Abstract
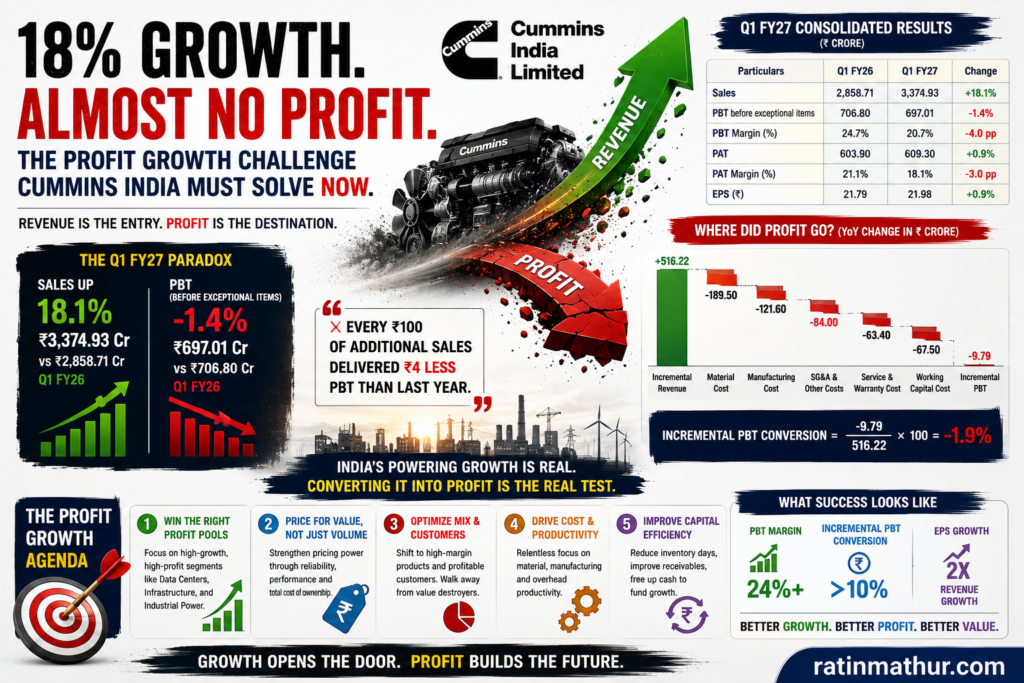
The most important message emerging from Cummins India Limited’s first-quarter FY2027 results is not that the company is struggling to grow. It is that the company is struggling to convert growth into profit. For an industrial enterprise operating in an expanding Indian power market, this distinction is strategically decisive. Cummins India reported sales of ₹3,374.93 crore for the quarter ended June 30, 2026, an increase of 18.1% over ₹2,858.71 crore in the corresponding quarter of the previous year. Yet profit before tax and exceptional items declined from ₹706.80 crore to ₹697.01 crore, while profit after tax increased only 0.9%, from ₹603.90 crore to ₹609.30 crore.
The central problem can therefore be stated precisely: Cummins India needs to restore profit growth without sacrificing the underlying revenue-growth opportunity in India. The strategic challenge is not simply cost reduction. It is to determine where profitable growth resides, why incremental revenue is currently producing insufficient incremental profit, and how management can redesign pricing, product mix, cost productivity, customer economics and capital allocation around profit rather than revenue alone.
This paper develops four proposed strategic frameworks: the Profit Growth Conversion™ Framework, the Incremental Profit Waterfall™, the India Profit Pool Selection™ Framework, and the Profit Growth Control Loop™. Together, they provide a practical architecture for converting a high-growth Indian market opportunity into sustainable profit growth.
The Strategic Paradox: 18.1% Sales Growth, But Almost No Profit Growth
The Q1 FY2027 results contain a contradiction that deserves greater attention than the headline revenue number. Cummins India’s sales increased by ₹516.22 crore year on year, yet PBT before exceptional items decreased by ₹9.79 crore.
| Cummins India consolidated performance | Q1 FY26 | Q1 FY27 | YoY change |
| Sales / income from operations | ₹2,858.71 Cr | ₹3,374.93 Cr | 18.1% |
| Total income | ₹3,040.70 Cr | ₹3,563.35 Cr | 17.2% |
| PBT before exceptional items | ₹706.80 Cr | ₹697.01 Cr | -1.4% |
| PAT | ₹603.90 Cr | ₹609.30 Cr | 0.9% |
| EPS | ₹21.79 | ₹21.98 | 0.9% |
| PBT before exceptional items / sales | 24.7% | 20.7% | -4.0 pp |
Source: Cummins India Limited Q1 FY2027 unaudited consolidated financial results.
The mathematics make the strategic problem even clearer. Incremental sales were ₹516.22 crore, while incremental PBT before exceptional items was negative ₹9.79 crore.
The incremental PBT conversion rate can therefore be expressed as:
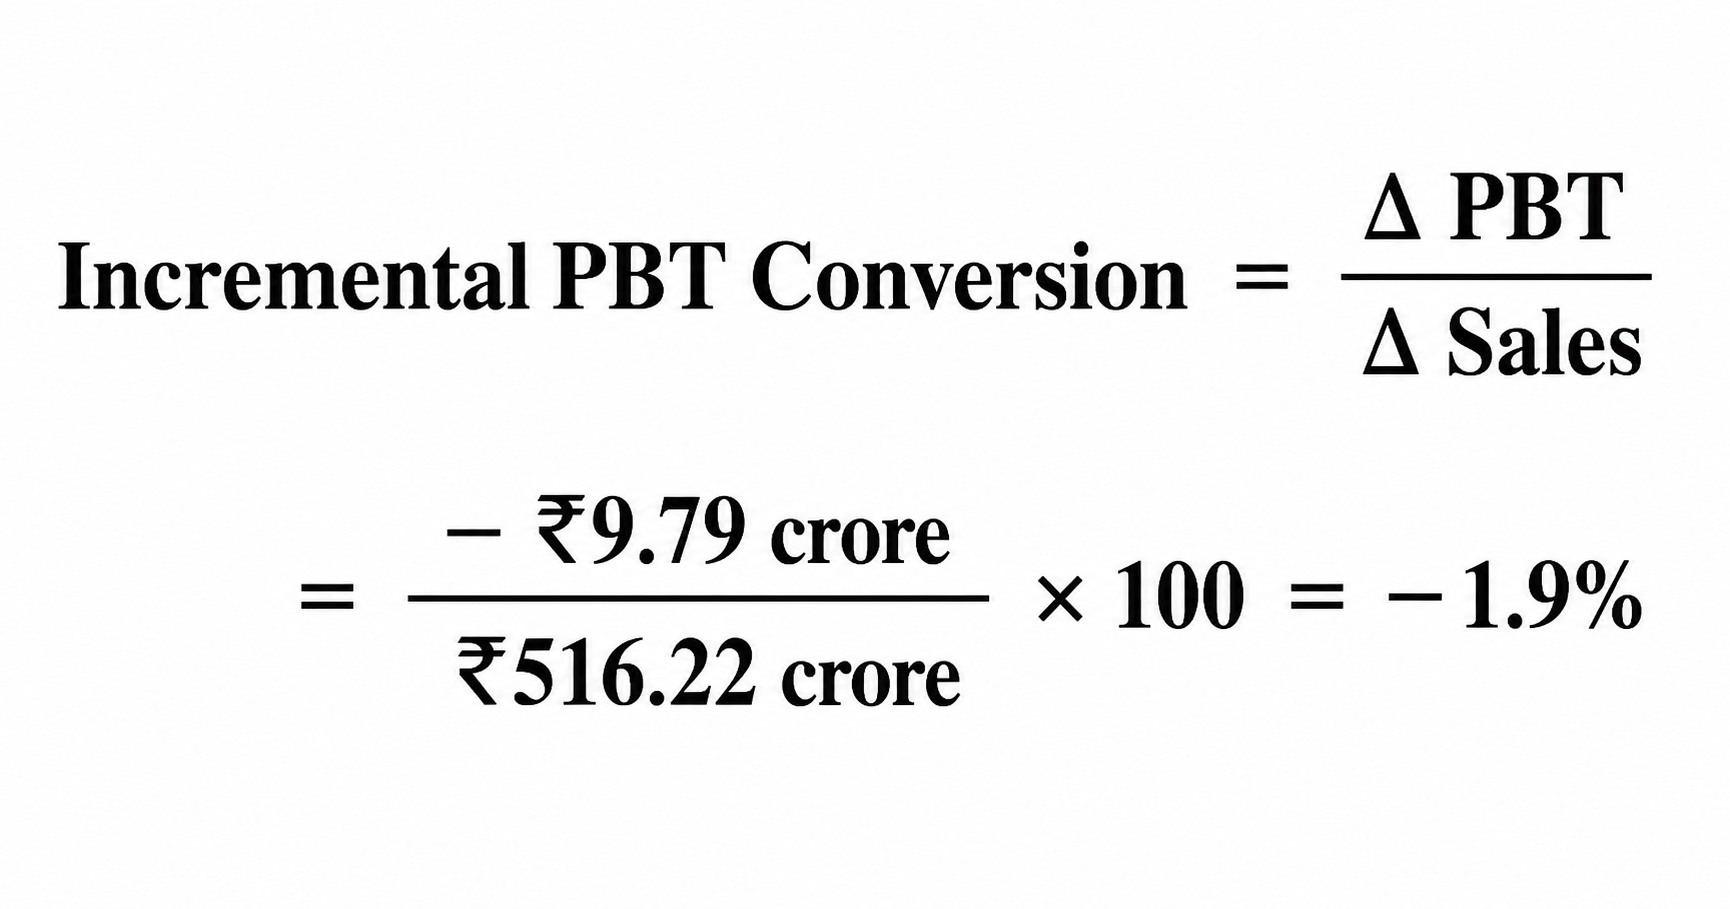
This does not mean that every incremental sale was loss-making. It means that, at the consolidated reported level, the aggregate incremental revenue generated in Q1 FY2027 did not produce incremental PBT compared with Q1 FY2026.
That is the real strategic signal.
A company can tolerate one quarter of weak profit conversion if the cause is temporary. It becomes strategically concerning when management does not know whether the deterioration originates from pricing, product mix, input economics, manufacturing productivity, customer mix, inventory movements or another factor.
The correct management question is therefore not, “How can Cummins India increase sales?” It is, “How can Cummins India increase the profit generated by every additional rupee of Indian revenue?”
The Profit Growth Conversion™ Framework
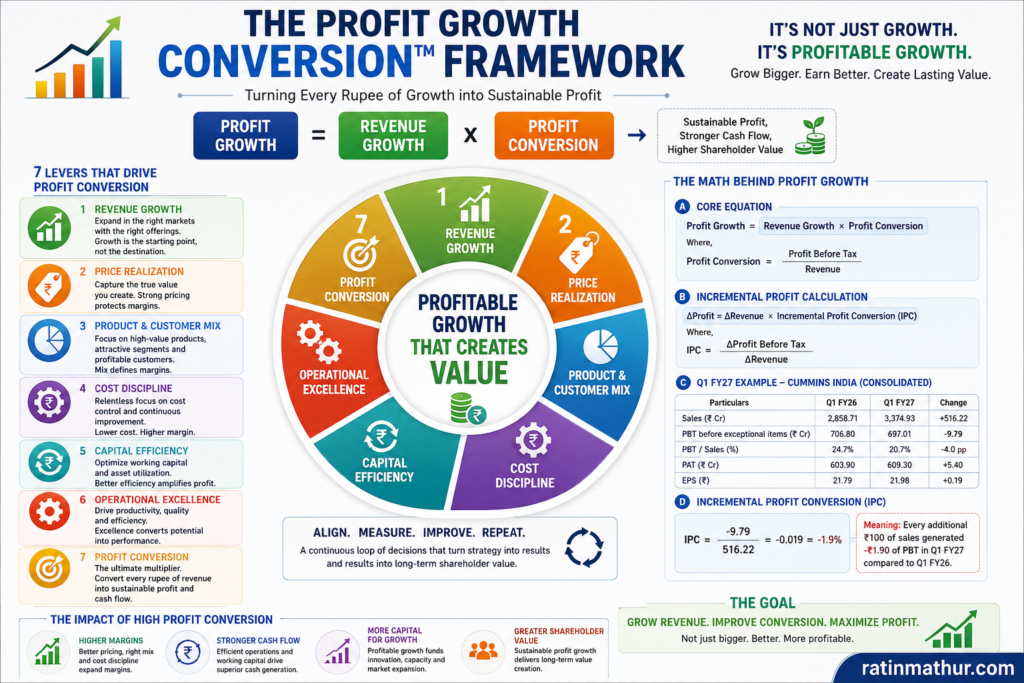
The Profit Growth Conversion™ Framework is the first proposed strategic framework. It is designed to prevent management teams from confusing revenue growth with value creation.
The framework establishes a simple equation:
Profit Growth = Revenue Growth x Profit Conversion
Revenue growth determines how much business is being added. Profit conversion determines how much economic value is extracted from that growth.
| Profit-growth driver | Q1 FY27 signal | Strategic question |
| Revenue growth | Strong at 18.1% | Is growth sustainable? |
| Price realization | Not disclosed in the filing | Has pricing captured value and cost inflation? |
| Product mix | Not disclosed | Is growth concentrated in higher- or lower-margin products? |
| Customer mix | Not disclosed | Are the fastest-growing customers economically attractive? |
| Material economics | Material cost increased 17.9% | Is cost increasing proportionately to revenue? |
| Employee cost | Increased 16.9% | Is operating leverage being achieved? |
| Other expenses | Increased 18.0% | Is the cost base scaling efficiently? |
| Inventory movement | Changed materially YoY | Is production aligned with profitable demand? |
| PBT | Declined 1.4% | Why is incremental revenue not producing incremental profit? |
The framework’s power lies in changing the definition of growth. Under conventional management reporting, ₹1,000 crore of additional revenue is always celebrated. Under Profit Growth Conversion™, ₹1,000 crore of additional revenue is considered attractive only if its contribution to sustainable profit and capital efficiency is attractive.
For example, suppose two hypothetical Indian customers each generate ₹100 crore of annual engine sales. Customer A generates ₹20 crore of contribution after material, logistics, warranty and service costs. Customer B generates ₹9 crore. A revenue-only organisation treats the customers as identical. A profit-growth organisation does not.
The strategic implication for Cummins India is significant. The company should progressively move its management conversation from “How much did we sell?” towards “How much sustainable profit did the incremental business create?”
The Cost Problem Is More Complex Than Simple Cost Inflation
The Q1 financial statement does not support the conclusion that the entire profit-growth problem is simply raw-material inflation.
| Expense category | Q1 FY26 | Q1 FY27 | YoY growth |
| Cost of materials consumed | ₹1,776.38 Cr | ₹2,094.41 Cr | 17.9% |
| Purchases of traded goods | ₹214.24 Cr | ₹214.95 Cr | 0.3% |
| Employee benefits | ₹199.43 Cr | ₹233.12 Cr | 16.9% |
| Depreciation & amortisation | ₹47.93 Cr | ₹52.59 Cr | 9.7% |
| Other expenses | ₹252.26 Cr | ₹297.68 Cr | 18.0% |
| Total expenses | ₹2,333.90 Cr | ₹2,866.34 Cr | 22.8% |
Source: Cummins India Limited unaudited consolidated results.
Total expenses increased faster than sales. This is important, but the underlying composition matters.
Material consumption increased almost exactly in line with sales. Employee costs and other expenses also increased broadly in line with sales. The most unusual movement occurred in the inventory adjustment, which changed from negative ₹158.99 crore in Q1 FY26 to negative ₹30.31 crore in Q1 FY27.
The change represents approximately ₹128.68 crore of year-on-year difference in the inventory-related P&L movement.
This should not automatically be interpreted as evidence of poor inventory management. The filing does not provide enough information to establish the cause. It could reflect production timing, finished-goods movement, work-in-progress, demand timing or other operational factors. The correct conclusion is therefore that inventory and production economics require deeper investigation.
This distinction is central to disciplined strategy: a financial signal is evidence of a question, not automatically evidence of its answer.
The Incremental Profit Waterfall™ Framework
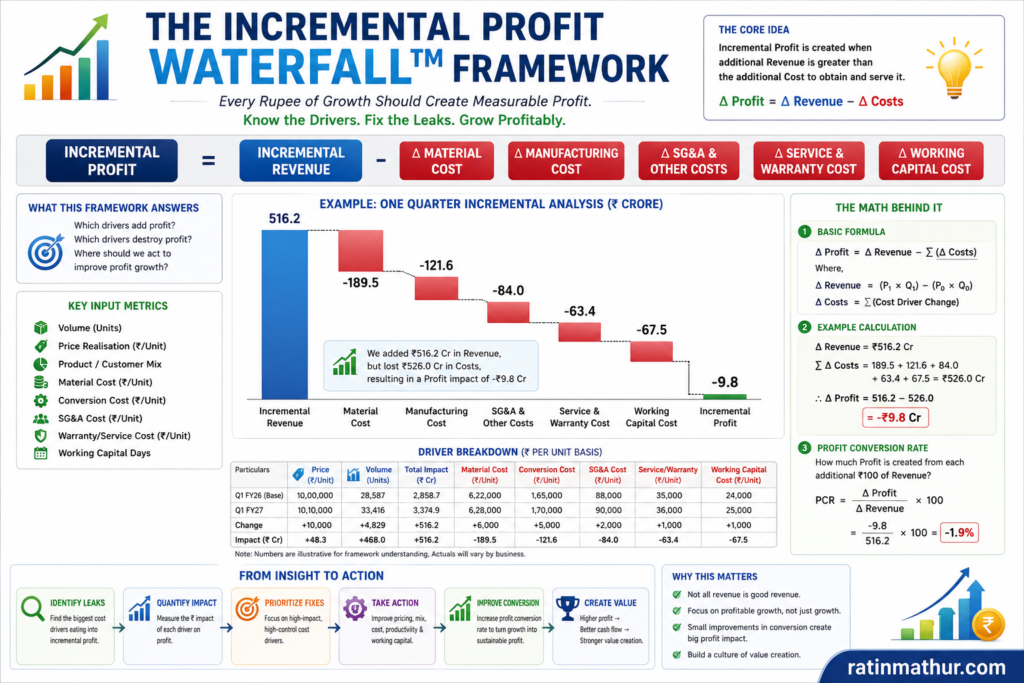
The Incremental Profit Waterfall™ Framework converts the aggregate profit problem into a sequence of measurable economic drivers.
The model is:
∆P = ∆V + ∆Pr + ∆M – ∆Cm – ∆C0 – ∆Cs – ∆Cw
where incremental profit is driven by changes in volume, price realization and mix, less changes in material, operating, service and working-capital-related economics.
For Cummins India, this framework should be constructed separately for major products, applications and customers.
| Waterfall stage | Management measurement | Example strategic question |
| Volume | Units sold × contribution/unit | Did additional volume create attractive contribution? |
| Price | Realised price − prior price | Did price capture inflation and value? |
| Product mix | Mix shift × margin differential | Did growth move towards better economics? |
| Material | Material cost/unit | Did procurement and engineering offset input pressure? |
| Manufacturing | Conversion cost/unit | Did scale create operating leverage? |
| Warranty | Warranty cost/unit | Is growth creating hidden future costs? |
| Service | Cost-to-serve/customer | Which customers are expensive to support? |
| Inventory | Capital tied up/unit | Is revenue growth consuming excessive capital? |
| Net incremental profit | Total incremental contribution | Which growth actually creates value? |
Consider a hypothetical example. If Cummins sells an engine for ₹10 lakh and earns ₹2 lakh contribution, a 10% increase in volume would be attractive only if the incremental units continue to generate approximately similar contribution. If additional units require aggressive discounting and higher logistics or warranty costs, volume growth may actually dilute profit.
The framework therefore encourages a crucial management discipline: never approve growth without understanding the economics of the growth.
Why India Makes the Profit-Growth Question More Important
The Indian power market provides a favourable structural backdrop. The Central Electricity Authority reported that peak demand met reached 270.820 GW in May 2026, while energy supplied reached 164.438 billion units. During the same month, India added 3,489.79 MW of renewable capacity. (Central Electricity Authority)
The CEA’s 20th Electric Power Survey projects India’s 2026–27 electricity requirement at 1,907,835 MU and peak demand at 277,201 MW. (Central Electricity Authority)
These numbers matter because they indicate that India’s long-term electricity requirement is substantial. Cummins India therefore does not appear to need a strategy based simply on creating demand where none exists. The strategic challenge is selecting and monetising the most attractive portions of the demand pool.
India’s data-centre expansion provides another illustration of emerging electricity-intensive demand. Government information reported through the Press Information Bureau indicated that India’s data-centre capacity increased from approximately 375 MW in 2020 to around 1,500 MW by 2025. (India Brand Equity Foundation)
For Cummins India, the strategic implication is not that data centres should automatically become a priority. The deeper implication is that India’s changing power architecture is creating new customer applications in which reliability, resilience and lifecycle performance may matter significantly.
The company therefore needs to determine where its technological capabilities translate into superior economic value.
The India Profit Pool Selection™ Framework
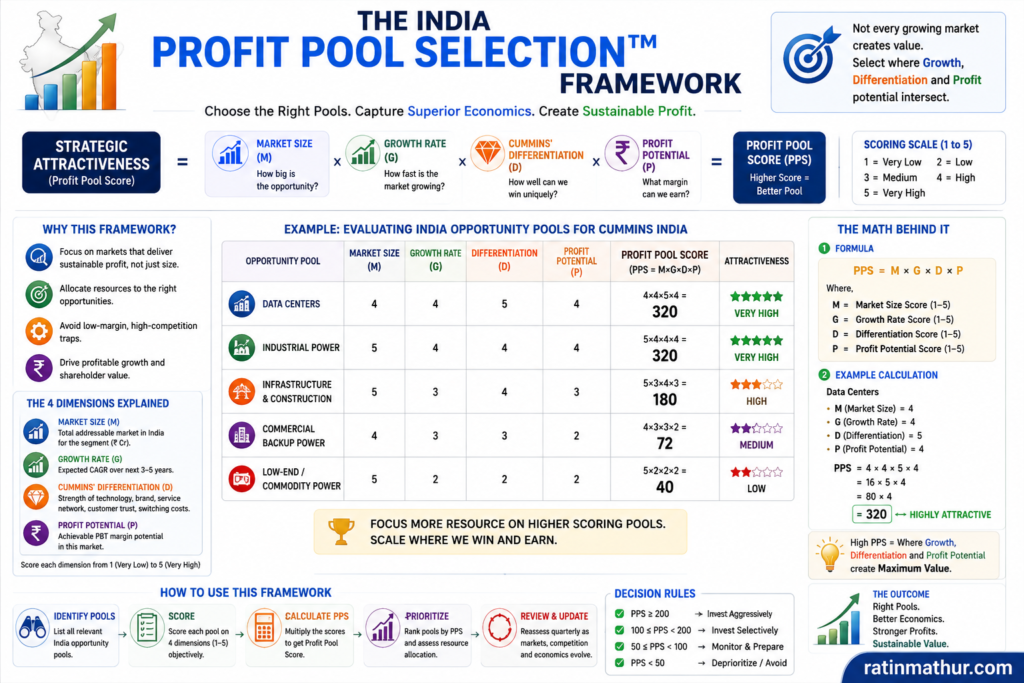
The India Profit Pool Selection™ Framework addresses this question by separating market growth from profit-pool attractiveness.
The model can be represented as:
Strategic Attractiveness = M x G x D x P
where (M) represents market size, (G) represents growth, (D) represents Cummins’ differentiation and (P) represents sustainable profit potential.
A large market with low differentiation may be less attractive than a smaller market where the company can command superior economics.
| Indian opportunity dimension | Market attractiveness | Profit-growth question |
| Industrial power | High | Can reliability and efficiency support premium economics? |
| Infrastructure | High | Can Cummins capture lifecycle value rather than equipment-only revenue? |
| Data centres | Emerging and strategically important | Can high-reliability requirements support differentiated economics? |
| Commercial backup power | Large | Is competition sufficiently intense to compress pricing? |
| Distributed power | Structural | Which applications provide attractive lifecycle profitability? |
| Lower-end commodity applications | Potentially large | Does volume justify lower margin and higher price pressure? |
The framework changes the strategic allocation of resources. Instead of asking which Indian markets are growing fastest, management asks which markets combine growth, differentiation, pricing potential and sustainable profitability.
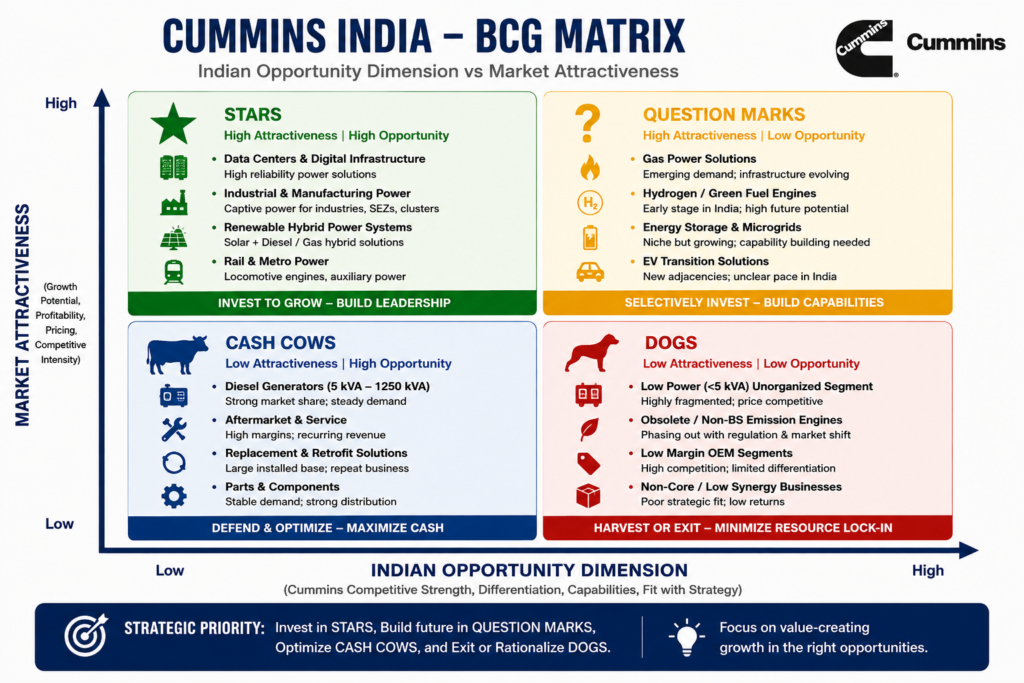
For example, suppose Market A is growing at 25% but Cummins has limited differentiation and customers routinely demand aggressive price concessions. Market B may be growing at only 15%, but reliability is critical, switching costs are higher and lifecycle economics support superior contribution. Market B could therefore create more shareholder value.
This is the essential distinction between market share strategy and profit-pool strategy.
The Engine Business Is the Critical Profit-Growth Laboratory
Cummins India’s segment information makes the profit-growth issue even more specific. Engine sales increased from ₹2,858.71 crore in Q1 FY26 to ₹3,374.93 crore in Q1 FY27, while Engine PBT declined from ₹755.80 crore to ₹741.08 crore.
| Engine segment | Q1 FY26 | Q1 FY27 | Change |
| Sales | ₹2,858.71 Cr | ₹3,374.93 Cr | +18.1% |
| PBT | ₹755.80 Cr | ₹741.08 Cr | -1.9% |
| Approx. PBT / sales | 26.4% | 22.0% | -4.4 pp |
| Incremental sales | — | ₹516.22 Cr | — |
| Incremental PBT | — | -₹14.72 Cr | — |
The Engine segment therefore provides the clearest evidence of the company’s profit-growth challenge.
The approximate Engine PBT margin fell from 26.4% to 22.0%. The decline is larger than the consolidated margin decline because the consolidated results also include contributions from other businesses and equity-accounted entities.
This makes Engine economics the natural starting point for the profit-growth programme.
The company should not interpret this as an argument against Engine growth. Quite the opposite. The objective should be to identify the portion of Engine growth that creates the greatest economic value and then deliberately scale that portion.
The Profit Growth Control Loop™ Framework
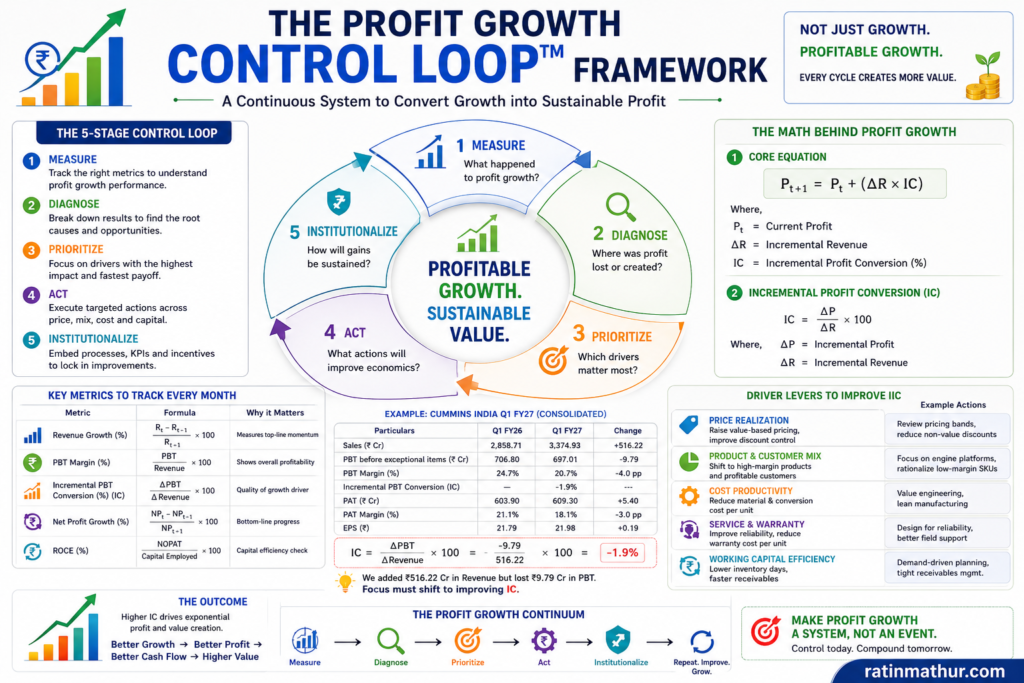
The fourth proposed framework is the Profit Growth Control Loop™. Its purpose is to ensure that profit growth becomes a recurring management system rather than a one-time cost-reduction exercise.
The loop consists of five interconnected stages: measure, diagnose, prioritise, act and institutionalise.
| Stage | Management question | Required output |
| Measure | What happened to profit growth? | Monthly profit-growth dashboard |
| Diagnose | Where was profit lost or created? | Product/customer/cost waterfall |
| Prioritise | Which drivers matter most? | Impact-based priority matrix |
| Act | What intervention will improve economics? | Pricing, mix, cost or productivity actions |
| Institutionalise | How will gains be sustained? | KPIs, incentives and governance |
The mathematical objective is straightforward:
Pt+1 = Pt + ∆R x IC
where (Pt) is current profit, (∆R) is incremental revenue and (IC) is incremental profit conversion.
If Cummins India wants profit to grow faster, it has two fundamental levers. It can increase incremental revenue, or it can increase the amount of profit generated from each incremental rupee of revenue.
The strategic danger is obvious. Increasing revenue while allowing incremental profit conversion to deteriorate can create the illusion of progress while weakening economics.
The Profit Growth Control Loop™ therefore requires management to monitor not only revenue growth and absolute PBT, but also incremental PBT conversion.
The New Management Equation: Growth Quality Over Growth Quantity
A more sophisticated corporate objective can be expressed as:
Value-Creating Growth = Revenue Growth x Incremental Margin x Capital Efficiency
This equation changes the strategic conversation.
| Conventional KPI | Profit-growth KPI |
| Revenue growth | Incremental profit growth |
| Market share | Profitable market share |
| Units sold | Contribution per unit |
| Customer revenue | Customer economic profit |
| Product revenue | Product contribution |
| Cost reduction | Cost reduction without quality erosion |
| Capacity utilisation | Economic return on capacity |
| Inventory turnover | Profit generated per rupee of working capital |
| Sales incentive | Profit-linked commercial incentive |
For Cummins India, this does not imply abandoning revenue targets. Revenue remains essential. The strategic shift is to make revenue a means to profit growth rather than treating revenue as the ultimate objective.
What Management Should Do Differently
The immediate priority should be a 90-day profit-growth diagnostic rather than a broad cost-cutting programme.
- The first analytical task should be to construct a product-level and customer-level profit waterfall for the Engine business. The company should identify the products, applications and customers responsible for the largest increase in revenue and determine whether they also generated attractive incremental contribution.
- The second task should be a price-versus-cost bridge. Management needs to establish whether realised pricing has kept pace with changes in materials, manufacturing and service economics.
- The third task should be an operational bridge around the ₹128.68 crore year-on-year difference in the inventory adjustment. The objective should not be to conclude that inventory is the problem, but to determine whether production, inventory and customer demand are synchronised around profitable growth.
- The fourth task should be a portfolio-profitability analysis of Indian applications. The purpose should be to identify where Cummins can achieve the combination of market growth, differentiation, pricing power and sustainable margin represented by the India Profit Pool Selection™ Framework.
- The fifth task should be to convert the analysis into management incentives. If sales teams continue to be rewarded predominantly for revenue, management should not be surprised if revenue growth outpaces profit growth. Incentives should progressively incorporate contribution margin, customer profitability and strategic mix.
A Practical Profit-Growth Target Architecture
A useful management architecture would distinguish between revenue growth, margin recovery and incremental profit conversion.
| Strategic metric | Q1 FY26 | Q1 FY27 | Management objective |
| Sales growth | Base | +18.1% YoY | Sustain healthy growth |
| Consolidated PBT before exceptional items | ₹706.80 Cr | ₹697.01 Cr | Restore positive YoY growth |
| PBT margin on sales | 24.7% | 20.7% | Recover lost margin progressively |
| PAT | ₹603.90 Cr | ₹609.30 Cr | Accelerate PAT growth |
| EPS | ₹21.79 | ₹21.98 | Restore stronger EPS growth |
| Engine PBT | ₹755.80 Cr | ₹741.08 Cr | Reverse decline |
| Engine PBT margin | 26.4% | 22.0% | Recover through profitable growth |
| Incremental consolidated PBT conversion | — | -1.9% | Move decisively into positive territory |
The table should not be interpreted as a forecast. It is a proposed management scorecard based on the Q1 FY2027 baseline.
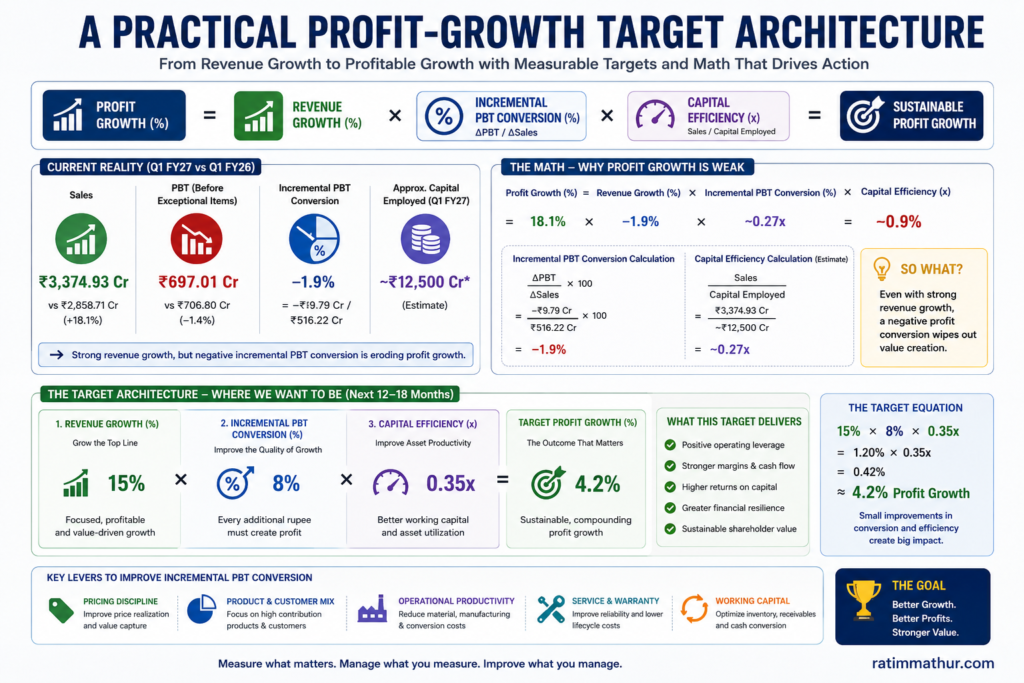
The most important KPI in this architecture is arguably incremental PBT conversion. If sales continue to grow at 15–20% but incremental PBT conversion remains weak, management should treat that as a warning signal rather than celebrating revenue growth alone.
The Strategic Conclusion: Cummins India’s Next Chapter Should Be Defined by Profit Growth
Cummins India’s Q1 FY2027 results do not suggest that India has stopped creating opportunities for the company. They suggest something more strategically interesting: the company’s ability to capture India’s growth is currently ahead of its ability to monetise that growth.
That is a solvable problem, but it requires a different management lens.
The company should preserve its growth ambition while becoming substantially more selective about the economics of growth. It should identify the Indian profit pools where its differentiation is strongest, understand the exact sources of Engine margin dilution, strengthen price and mix discipline, improve unit economics, align production and inventory with profitable demand, and redesign performance management around incremental profit.
The central equation should move from:
More Sales -> More Profit
to:
Better Growth -> Higher Incremental Contribution -> Higher PBT -> Higher EPS -> Higher Shareholder Value
That is the strategic shift.
India’s power requirement is expanding. The CEA’s projections indicate substantial electricity and peak-demand requirements for 2026–27, while current power-sector data shows the continuing scale of India’s electricity system. (Central Electricity Authority) Cummins India therefore has the underlying market opportunity to grow.
The strategic question is whether it can grow profitably.
The answer will not come from one cost-saving initiative, one product launch or one new customer. It will come from creating a management system in which every major growth decision is tested against the same question:
How much sustainable profit will this rupee of revenue create?
That is the essence of the Profit Growth Conversion™ philosophy.
For Cummins India, the next phase of competitive advantage may therefore not be determined simply by how much of India’s power economy it serves, but by how intelligently it chooses the parts of that economy in which to compete.
References
(1) Cummins India Limited. (2026, August 5). Outcome of Board Meeting and unaudited consolidated and standalone financial results for the quarter ended June 30, 2026. Cummins India Limited. Cummins India investor notices
(2) Cummins Inc. (2026). India financials. Cummins Inc. Cummins India financial results
(3) Central Electricity Authority. (2026). Indian power sector performance during May 2026. Ministry of Power, Government of India. Central Electricity Authority
(4) Central Electricity Authority. (2022). 20th Electric Power Survey of India: Report and electricity demand projections. Ministry of Power, Government of India. 20th Electric Power Survey of India
(5) Press Information Bureau. (2026, March 16). Data centre capacity in the country has increased from about 375 MW in 2020 to around 1500 MW by 2025. Government of India. Press Information Bureau / India data-centre capacity
Disclaimer
This article is an independent strategic analysis based principally on Cummins India Limited’s unaudited financial results for the quarter ended June 30, 2026, supplemented where indicated by Indian power-sector information from public sources. The financial figures and company-specific facts are derived from the attached company filing. Interpretations concerning the causes of profit-growth pressure are analytical hypotheses where the company filing does not provide sufficient evidence to establish causality. The article is not investment advice, an equity research report, a valuation opinion, a recommendation to buy or sell securities, or a forecast of Cummins India’s future financial performance. The proposed frameworks identified with the ™ designation are conceptual strategic frameworks developed for this article and should not be interpreted as claims of registered trademark ownership.