A Four-Country Macroeconomic and Investment Framework for an Era of Debt, Geopolitical Fragmentation and Artificial Intelligence
Executive Summary
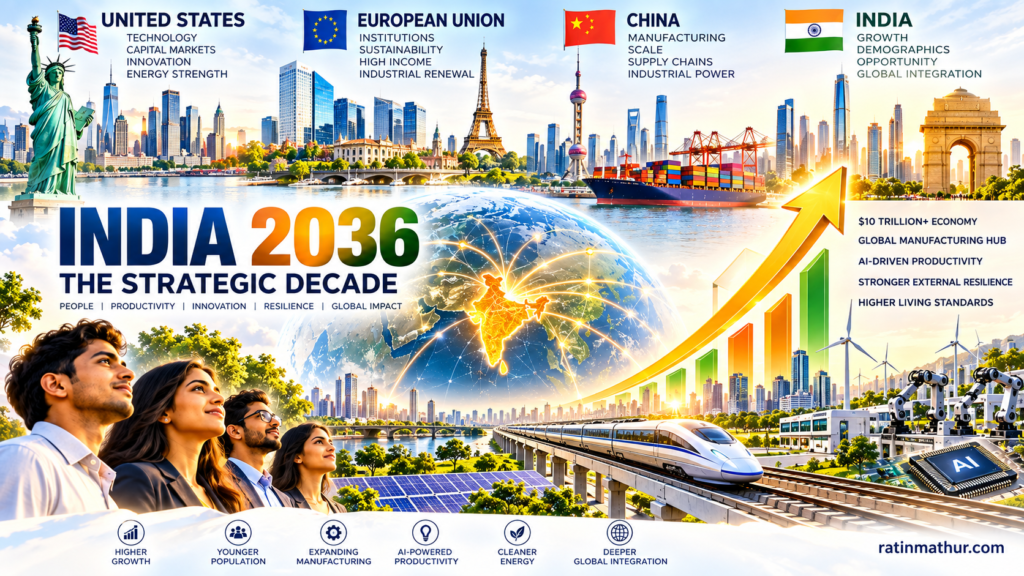
The decade from 2026 to 2036 is likely to be defined by a structural reordering of the global economy rather than by a conventional economic cycle. The United States enters the period with unparalleled technological and financial power but an increasingly consequential fiscal constraint. China enters with extraordinary industrial capacity and a large external surplus, but faces demographic contraction, property adjustment and high leverage. The European Union remains one of the world’s largest and wealthiest economic blocs, but must overcome weak productivity, ageing, energy vulnerability and fiscal fragmentation. India enters from a very different position: much lower income per capita, but faster growth, a younger population, a large domestic market, expanding digital infrastructure, resilient services exports and an opportunity to absorb manufacturing and supply-chain investment.
The central argument of this paper is that the most important question for India is not whether the United States will experience a conventional debt crisis. It is whether persistently high US borrowing gradually produces a higher global risk-free rate, a stronger or more volatile dollar, greater competition for capital and reduced policy flexibility. The Congressional Budget Office projects US federal debt held by the public to rise from approximately 101% of GDP in 2026 to 120% in 2036, while net interest costs rise from 3.3% to 4.6% of GDP. Net interest outlays are projected to increase from about $1.0 trillion to $2.1 trillion over the decade. (cbo.gov)
This creates a global transmission mechanism that matters greatly for India: US fiscal pressure can influence Treasury yields; Treasury yields influence global capital allocation; capital allocation affects the dollar and emerging-market flows; the dollar interacts with oil prices; and oil, the dollar and capital flows jointly affect India’s inflation, current account, monetary policy and asset valuations.
The quantitative strategic model developed for this paper indicates that India could approach a nominal GDP of roughly $9–10 trillion by 2036 in a base case and potentially exceed $10 trillion in a high-productivity breakout scenario. These are modelled strategic outcomes rather than official forecasts. The more important objective is not a headline GDP ranking but a simultaneous improvement in productivity, investment, manufacturing exports, employment, female labour-force participation, external resilience and fiscal sustainability.
The paper proposes four proprietary strategic frameworks under the Strategic Frameworks & Recommendations section: the Global Shock Transmission Matrix™, the India External Resilience Triangle™, the 2036 Productivity–Capital–Demography Flywheel™, and the India Strategic Asset Allocation Compass™. Together they convert macroeconomic observations into a decision architecture for policymakers, businesses and long-term investors.
Introduction
The global economy of 2026 is entering a period in which fiscal policy, geopolitics, technology and capital markets can no longer be analysed independently. The post-globalisation assumption that capital would remain abundant, trade would continually deepen and inflation would remain structurally subdued has weakened. The International Monetary Fund’s April 2026 World Economic Outlook describes a global economy operating in the shadow of war, higher trade barriers and elevated uncertainty. It projects global growth of 3.1% in 2026 and 3.2% in 2027 and identifies prolonged conflict, geopolitical fragmentation, renewed trade tensions and disappointment surrounding artificial-intelligence productivity as significant downside risks. (imf.org)
Against this background, the United States, European Union, China and India represent four distinct economic models. The United States combines technological leadership, deep capital markets, energy production and the world’s dominant reserve currency with a growing fiscal burden. China combines manufacturing scale, high savings, industrial policy and technological capability with demographic decline and significant public and quasi-public leverage. Europe combines high incomes, institutional depth and advanced industrial capabilities with weaker trend growth and an ageing population. India combines lower income levels with high potential growth, favourable demographics, a large domestic market and an opportunity to become a major global manufacturing and services platform.
The decade ahead should therefore not be interpreted simply as a competition for the title of the world’s largest economy. It is more appropriately viewed as a competition between different forms of economic power: technological power, financial power, manufacturing power, demographic power and resilience.
Problem Statement & Objectives
The central problem is that conventional macroeconomic analysis often treats fiscal sustainability, growth, energy, geopolitics, capital flows and investment markets as separate variables. In reality, they form a connected system. A higher US debt burden can raise Treasury issuance and, depending on investor demand and monetary conditions, place upward pressure on global yields. Higher yields can strengthen the dollar or reduce the relative attractiveness of emerging-market assets. A stronger dollar can increase the local-currency cost of imported commodities. Higher oil prices can simultaneously widen India’s current-account deficit and raise domestic inflation. Monetary tightening can then weaken investment and financial valuations.
The objective of this paper is therefore to construct a 2026–2036 strategic lens through which India can be evaluated against the United States, European Union and China. The analysis seeks to determine where India’s structural advantages are strongest, where vulnerabilities remain, how global shocks may transmit into India, and which indicators should be monitored as early-warning signals.
| Strategic objective | Question addressed |
|---|---|
| Economic scale | How could the relative economic weight of the US, EU, China and India change by 2036? |
| Growth | Which economy has the strongest structural growth engine? |
| Fiscal resilience | Which economies face the greatest debt and interest-burden risks? |
| External resilience | Which economies depend most on foreign capital, trade or energy imports? |
| Demographics | Which countries gain or lose from population and labour-force trends? |
| Technology | How could AI and productivity alter relative growth trajectories? |
| Investment | Which Indian assets and sectors are most resilient under different global regimes? |
| Early warning | Which indicators should trigger a change in India’s macro and investment strategy? |
Methodology
The analysis combines official 2026 data with a strategic scenario model covering 2026–2036. The principal 2026 macroeconomic anchors are drawn from the IMF April 2026 World Economic Outlook and DataMapper, while US fiscal projections are anchored to the Congressional Budget Office’s February 2026 Budget and Economic Outlook. India-specific external-debt information is drawn from the Government of India’s Department of Economic Affairs.
The IMF’s 2026 data show US nominal GDP of approximately $32.38 trillion, EU GDP of $23.03 trillion, Chinese GDP of $20.85 trillion and Indian GDP of approximately $4.1 trillion. India’s 2026 real growth rate is around 6.5%, compared with 2.3% for the United States, 1.3% for the European Union and 4.4% for China. (imf.org)
The model distinguishes between official projections and strategic assumptions. IMF projections are available through 2031; therefore, estimates for 2032–2036 are scenario-based extensions rather than institutional forecasts. Nominal GDP is modelled from real growth, inflation and assumed currency movements. PPP GDP is projected by compounding real growth from the 2026 base. Debt, current-account, reserves, commodity-price and interest-rate paths are scenario assumptions designed to test resilience rather than predict precise future values.
| Modelling layer | Treatment |
|---|---|
| 2026 baseline | IMF and official national data |
| US fiscal trajectory | CBO 2026–2036 baseline |
| 2027–2031 | IMF-informed and scenario-adjusted |
| 2032–2036 | Strategic assumptions |
| India base case | Approximately 6–7% real growth |
| India breakout case | Approximately 7% or higher sustained growth |
| India stagflation case | Approximately 5% growth with elevated inflation |
| India crisis case | Severe external shock followed by gradual recovery |
| Investment implications | Scenario-based, not personalised investment advice |
Landscape Analysis
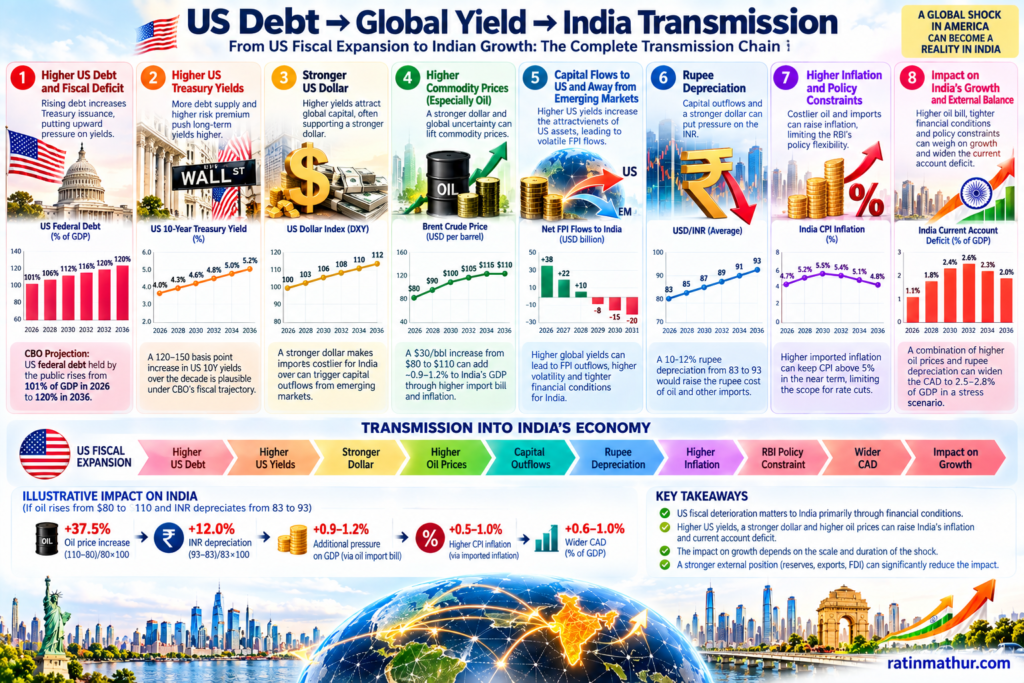
The starting point is unusually asymmetric. The United States has the highest income per capita and the deepest financial markets. China has the largest PPP economy among the four and an enormous manufacturing ecosystem. Europe remains a high-income economic bloc with a substantial current-account surplus. India is much smaller in nominal GDP and much poorer in per-capita terms, but its growth rate and demographic profile are substantially more favourable.
| Indicator, 2026 | United States | EU-27 | China | India |
|---|---|---|---|---|
| Nominal GDP, $ trillion | 32.38 | 23.03 | 20.85 | ~4.10 |
| PPP GDP, $ trillion international | 32.38 | 30.68 | 44.30 | ~19.00 |
| GDP per capita, $ | 94,430 | 51,030 | 14,870 | 2,810 |
| Real GDP growth | 2.3% | 1.3% | 4.4% | 6.5% |
| Inflation | 3.2% | 2.8% | 1.2% | 4.7% |
| Population | 343m | 451m | ~1.40bn | ~1.48bn |
| Current account/GDP | -3.7% | +2.0% | +3.5% | ~-2.0% |
| General government balance/GDP | -7.5% | -3.4% | -8.2% | ~-7.4% |
| General government debt/GDP | 125.8% | 83.5% | 106.9% | ~83.4% |
Source: IMF April 2026 World Economic Outlook and DataMapper. (imf.org)
The fiscal comparison is especially revealing. The United States has the highest debt ratio among the four on the IMF’s general-government measure, while China has a higher debt burden than Europe and India. Yet debt ratios alone do not determine vulnerability. Currency denomination, domestic savings, maturity structure, financial depth, growth and investor composition matter. The US has the exceptional advantage of issuing the world’s principal reserve currency, whereas India benefits from faster growth but has greater sensitivity to external financing conditions.
Europe’s position is more nuanced than a simple aggregate debt number suggests. Eurostat reported EU government debt at 82.9% of GDP at the end of the first quarter of 2026 and euro-area debt at 88.9%. (ec.europa.eu) The European challenge is therefore less about a single sovereign debt problem and more about the interaction between ageing, low productivity, energy costs, defence requirements and fiscal fragmentation.
China’s 2026 current-account surplus of approximately 3.5% of GDP contrasts sharply with the US deficit of 3.7% and India’s deficit of approximately 2%. (imf.org) This distinction is critical because external surpluses provide a buffer during periods of capital-market stress. India must therefore improve the composition and durability of its external financing rather than depend excessively on volatile portfolio flows.
Key Findings
The first major finding is that the US debt problem is more likely to manifest as a prolonged fiscal squeeze than as a conventional sovereign default. CBO projects the federal deficit to rise from $1.9 trillion in 2026 to $3.1 trillion in 2036, while debt held by the public rises from 101% to 120% of GDP. Net interest costs rise from approximately $1.0 trillion to $2.1 trillion. CBO also projects federal debt held by the public to reach 175% of GDP by 2056 under current law. (cbo.gov)
The second finding is that US fiscal pressure matters to India primarily through financial conditions rather than through direct trade exposure. If US yields remain structurally elevated, Indian bonds must compete with a higher global risk-free rate. Higher yields can reduce the valuation premium available to emerging-market equities, increase government borrowing costs and make foreign portfolio flows more volatile.
The third finding is that India possesses a distinctive combination of structural advantages and cyclical vulnerabilities. Its structural advantages are growth, demographics, domestic demand, digital infrastructure, services exports and manufacturing potential. Its cyclical vulnerabilities are oil imports, currency sensitivity, external capital flows and inflation.
The fourth finding is that China and India represent opposite demographic stories. China enters the period with enormous industrial scale but a declining population trajectory, while India retains a large and comparatively young population. The demographic advantage, however, is conditional. A large working-age population creates economic power only when education, skills, labour-force participation, infrastructure and productive employment convert population into output.
The fifth finding is that AI could alter the ranking more profoundly than conventional GDP projections imply. The United States has a strong advantage in frontier AI, capital markets and technology companies. China has advantages in industrial deployment, manufacturing and robotics. India has the opportunity to become a major beneficiary of AI diffusion across services, finance, manufacturing, logistics, healthcare and government. The key Indian question is therefore not merely whether India invents frontier AI, but whether AI raises economy-wide productivity.
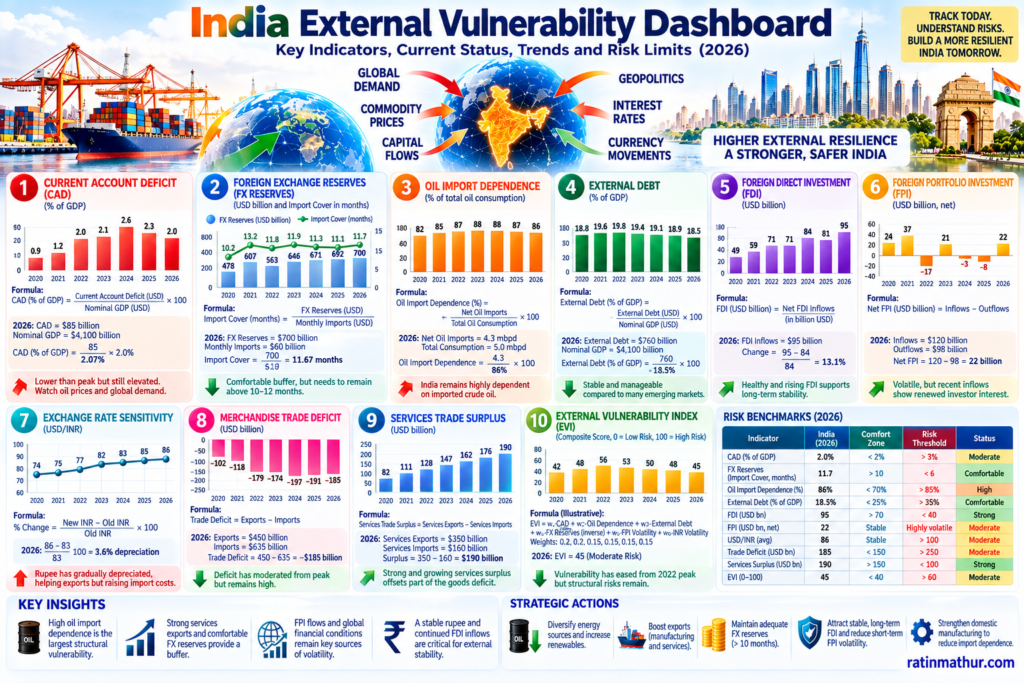
The sixth finding is that India’s external resilience must improve faster than its GDP expands. India’s external debt stood at $765.5 billion at end-December 2025, equivalent to 20.4% of GDP. (dea.gov.in) This ratio is manageable, but the strategic objective should be to ensure that foreign-exchange reserves, services exports, merchandise exports, FDI and remittances grow faster than external financing requirements.
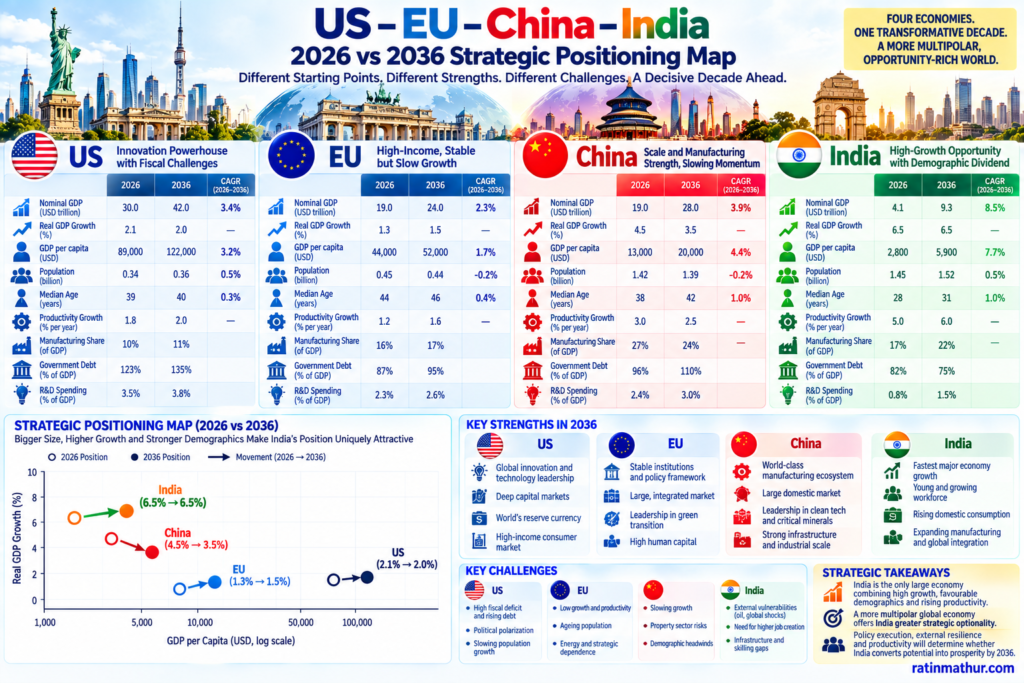
| 2036 strategic base-case model | US | EU | China | India |
|---|---|---|---|---|
| Nominal GDP | ~$45–50T | ~$30–34T | ~$30–36T | ~$9–10T |
| PPP GDP | ~$39–45T | ~$34–40T | ~$65–75T | ~$35–42T |
| GDP per capita | ~$120–135K | ~$65–80K | ~$22–28K | ~$5–7K |
| Real growth potential | 1.5–2.2% | 1–1.8% | 3–4.5% | 6–7% |
| Demographic direction | Moderate growth | Stagnation/decline | Decline | Continued growth |
| Primary strategic asset | Technology and capital | Institutions and high income | Manufacturing and scale | Growth and demographics |
| Principal vulnerability | Fiscal burden | Productivity and ageing | Demography and debt | Productivity and external sensitivity |
The seventh finding is that India’s optimal policy objective is not to maximise headline GDP at any cost. It is to maximise the combination of growth and resilience. A 7% economy with repeated external crises can produce less durable wealth than a 6.5% economy with strong reserves, low inflation, stable debt dynamics and high domestic investment.
Challenges & Opportunities
India’s greatest challenge is the conversion of demographic scale into productivity. If the labour force expands without adequate formal employment, skills and productive capital, the demographic dividend can become a demographic burden. The country therefore needs a simultaneous expansion of manufacturing, infrastructure, services, urbanisation, female labour-force participation and human capital.
The second challenge is energy. India’s dependence on imported crude makes the country unusually sensitive to the combination of high oil prices and a strong dollar. The most adverse external configuration is therefore not high oil alone, nor high US yields alone, but high oil, high US yields and a strong dollar occurring simultaneously.
The third challenge is fiscal. India’s government debt burden remains high, and maintaining high public investment while gradually improving fiscal sustainability requires better tax mobilisation, efficient expenditure and faster nominal GDP growth. The goal should be to reduce debt gradually without sacrificing productive public capital expenditure.
The fourth challenge is geopolitical fragmentation. India can benefit from supply-chain diversification, but only if domestic logistics, customs, infrastructure, electricity reliability, land access, skills and industrial ecosystems become globally competitive.
The fifth challenge is financial-market valuation. India’s structural growth story can coexist with periods of significant market underperformance. High global yields, expensive valuations, oil shocks or geopolitical crises can produce substantial short-term corrections even while the long-term economic thesis remains intact.
The opportunities are correspondingly large. India can become a major alternative manufacturing platform, a global services and technology centre, a digital public-infrastructure leader, a defence and aerospace manufacturing base, a renewable-energy and power-market giant, and an increasingly important destination for global capital.
Strategic Frameworks & Recommendations
Global Shock Transmission Matrix™
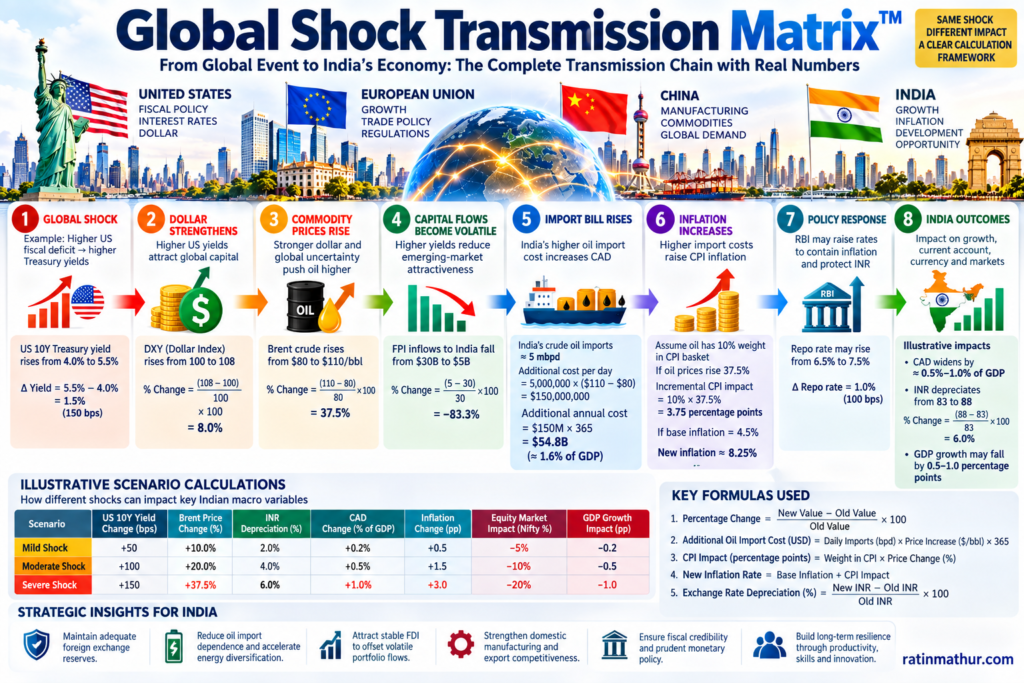
The Global Shock Transmission Matrix™ converts external developments into a structured assessment of their likely impact on India. The central principle is that a global event matters to India not because it is large or dramatic in itself, but because of the channels through which it enters the Indian economy. The framework begins with an external shock such as US fiscal expansion, an oil disruption, a China slowdown, a tariff escalation or a geopolitical conflict. It then tracks the shock through Treasury yields, the dollar, commodities, capital flows, inflation, the current account, monetary policy and asset valuations. The framework should be used by policymakers, corporate strategy teams and institutional investors as a recurring macro-risk assessment tool.
| External shock | First-order transmission | Second-order India effect | Principal risk | Strategic response |
|---|---|---|---|---|
| US fiscal deterioration | US Treasury yields rise | Higher Indian bond yields and capital-flow volatility | Valuation compression | Maintain fiscal credibility and reserve buffers |
| US dollar appreciation | Emerging-market currencies weaken | INR pressure and imported inflation | RBI policy constraint | Increase reserves and reduce external vulnerability |
| Oil shock | Import bill rises | CAD widens and inflation rises | Stagflation | Accelerate energy diversification |
| China slowdown | Global trade and commodity demand weaken | Export and investment effects | Manufacturing demand shock | Diversify export markets |
| Trade-war escalation | Supply chains fragment | Manufacturing opportunity and trade risk | Higher input costs | Deepen domestic value addition |
| Middle East conflict | Oil and freight risks rise | Inflation and CAD pressure | External shock | Build strategic energy buffers |
| AI productivity boom | Global productivity rises | Lower costs and new export opportunities | Labour displacement | Accelerate AI adoption and reskilling |
An example demonstrates the framework’s value. Suppose US debt concerns cause the US 10-year Treasury yield to rise materially while Brent crude rises above $110 a barrel. The first effect on India is financial, through higher global yields and potentially weaker foreign portfolio flows. The second effect is external, through a larger oil import bill. The third effect is monetary, through higher inflation. The fourth effect is market-based, through lower valuation multiples. The appropriate response is therefore not a single interest-rate decision; it is a coordinated strategy involving reserves, energy policy, fiscal credibility, monetary policy and selective capital allocation.
India External Resilience Triangle™
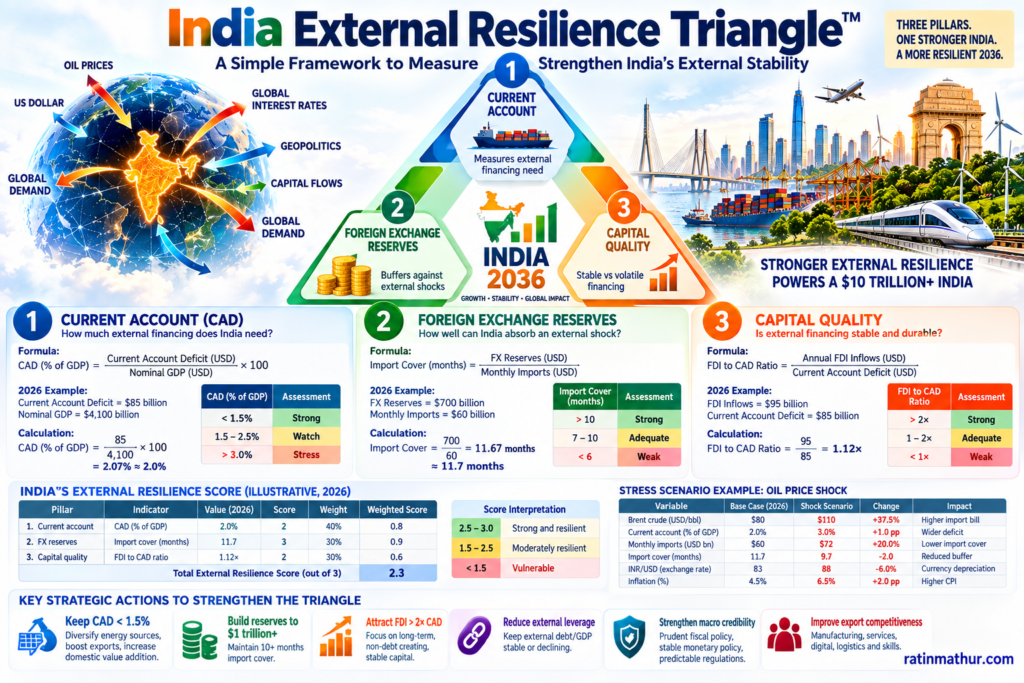
The India External Resilience Triangle™ defines India’s external stability through three interacting pillars: the current account, foreign-exchange reserves and capital quality. The first pillar measures how much external financing India requires. The second measures the country’s ability to absorb a sudden stop or external shock. The third distinguishes stable financing such as FDI and long-term investment from more volatile flows such as portfolio capital. The framework’s central proposition is that India’s external position should be judged not by reserves or the current account in isolation, but by the relationship between external financing needs and the quality of financing available to meet them.
| Triangle dimension | Strategic indicator | Strong position | Warning position | Stress position |
|---|---|---|---|---|
| External balance | CAD/GDP | <1.5% | 1.5–2.5% | >3% |
| Reserve buffer | Import cover | >10 months | 7–10 months | <6 months |
| Capital quality | FDI relative to CAD | >2x | 1–2x | <1x |
| External leverage | External debt/GDP | Stable/falling | Moderately rising | Rapidly rising |
| Liquidity risk | Reserves/short-term external debt | Strong | Adequate | Weak |
India’s external debt of $765.5 billion and 20.4% of GDP at end-December 2025 illustrates why this framework is useful. (dea.gov.in) The objective is not to eliminate external debt, because productive external capital can accelerate development. The objective is to ensure that external debt and the current-account deficit remain comfortably financeable. If India can simultaneously maintain CAD below approximately 1.5% of GDP, attract FDI materially above its external financing gap and build reserves toward the $1 trillion range, external shocks become significantly easier to absorb.
A practical example is a crude-oil shock. If oil rises sharply, the current account deteriorates. If FDI remains strong and reserves continue rising, the shock can be absorbed without a disorderly currency adjustment. If FDI weakens, FPI leaves and reserves fall at the same time, the same oil shock becomes a much larger macroeconomic event. The triangle therefore transforms three apparently separate indicators into a single external-resilience test.
2036 Productivity–Capital–Demography Flywheel™
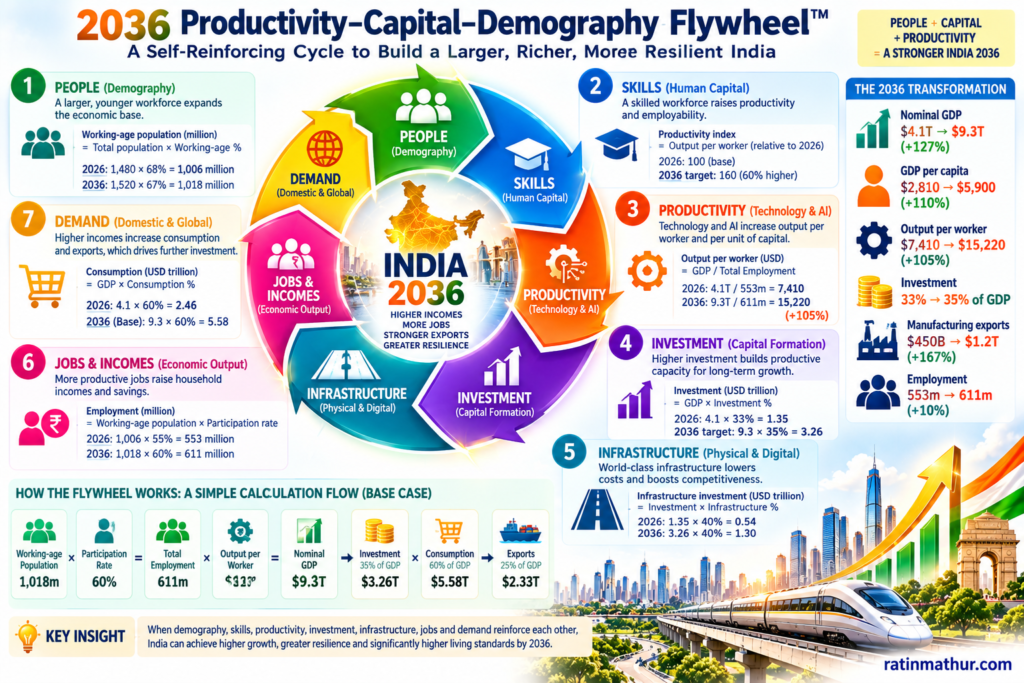
The 2036 Productivity–Capital–Demography Flywheel™ argues that India’s demographic advantage becomes economically valuable only when it is connected to capital formation and productivity. Population creates labour supply and consumption demand; investment creates productive capacity; productivity determines how much output each worker and unit of capital can generate. The flywheel is therefore designed around the relationship between workforce quality, investment, technology and income.
| Flywheel component | 2026 strategic position | 2036 objective | Economic mechanism |
|---|---|---|---|
| Demography | Large and relatively young population | High-quality labour force | Expands labour supply |
| Human capital | Uneven | Higher skills and employability | Raises productivity |
| Investment | Strong but needs scale | 33–36% of GDP | Expands productive capital |
| Manufacturing | Underdeveloped relative to potential | Major export platform | Creates jobs and exports |
| Services | Major global strength | Higher-value services | Generates foreign exchange |
| AI | Rapid adoption | Economy-wide diffusion | Raises productivity |
| Infrastructure | Rapidly improving | World-class connectivity and power | Lowers transaction costs |
| Female participation | Large upside | Sustained increase | Expands effective workforce |
The framework’s critical insight is that these variables reinforce one another. Higher investment creates factories, infrastructure and digital capacity. Better infrastructure makes manufacturing and services more competitive. Higher employment raises household income. Higher income increases savings and consumption. Greater savings support investment. AI increases productivity, improving returns on capital and raising the ability to finance further investment.
The opposite is also true. Weak employment reduces consumption, weak productivity lowers investment returns, inadequate investment limits capital formation and poor human capital prevents the demographic dividend from being realised. India should therefore evaluate major policies by their contribution to the flywheel rather than only by their immediate contribution to GDP.
India Strategic Asset Allocation Compass™
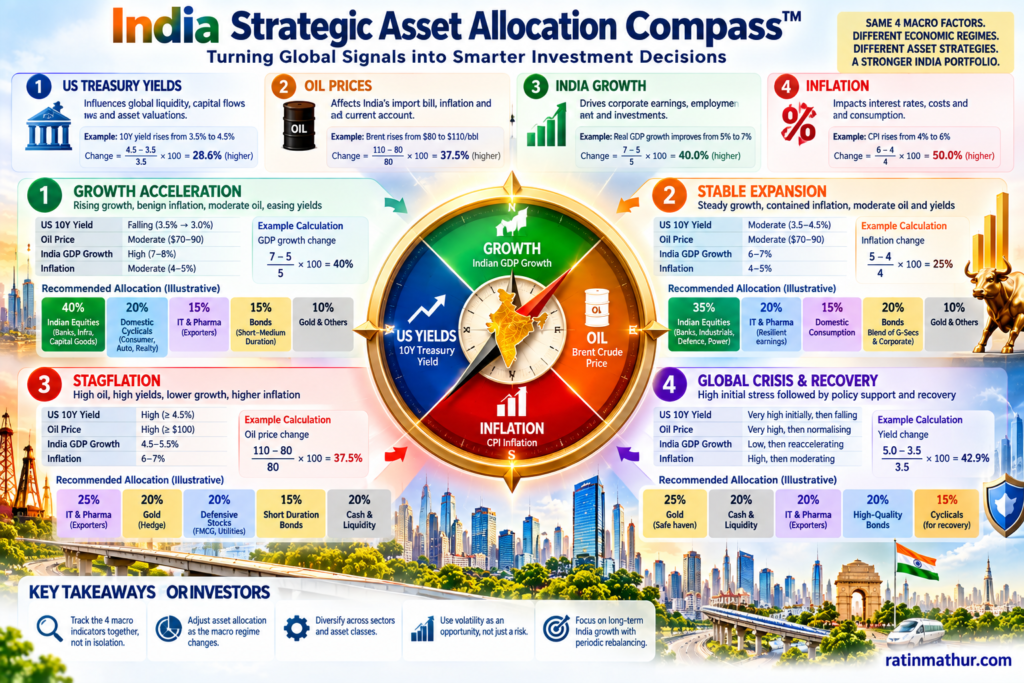
The India Strategic Asset Allocation Compass™ translates the macroeconomic regime into investment implications without assuming that any single asset class will outperform in every environment. It is based on four observable variables: US Treasury yields, oil prices, Indian growth and inflation. The intersection of these variables defines the macro regime and therefore changes the preferred mix of equities, bonds, gold, exporters, domestic cyclicals and defensives.
| Macro regime | US yields | Oil | Indian growth | Preferred Indian exposure | Principal risk |
|---|---|---|---|---|---|
| Growth acceleration | Falling/moderate | Moderate | High | Banks, capital goods, infrastructure, manufacturing, consumer, IT | Valuation excess |
| Stable expansion | Moderate | Moderate | 6–7% | Banks, industrials, defence, power, IT, pharma | External shock |
| Stagflation | High | High | 4.5–5.5% | IT exporters, pharma, defence, gold, selective energy | Margin compression |
| Global crisis | Very high initially | Very high initially | Low | Gold, liquidity, exporters, defensives | Liquidity and earnings shock |
| Recovery after crisis | Falling | Normalising | Reaccelerating | Banks, infrastructure, industrials, property-linked sectors | Premature risk-taking |
The framework illustrates why a long-term investor should not equate India’s structural growth story with a permanently bullish equity market. In a stagflation regime, technology exporters and pharmaceutical companies may possess better earnings resilience than highly leveraged domestic cyclicals. In a growth-acceleration regime, banks, capital goods, infrastructure, manufacturing and discretionary consumption can benefit from rising credit and investment. During a global liquidity crisis, gold and high-quality liquidity become strategic rather than speculative assets. Once yields peak and growth begins to recover, duration and cyclical equities can regain attractiveness.
The strategic recommendation is therefore to build portfolios around economic regimes rather than forecasts. The objective is not to predict every market movement but to recognise when the macroeconomic regime has changed sufficiently to justify a change in risk exposure.
Future Outlook & Conclusion
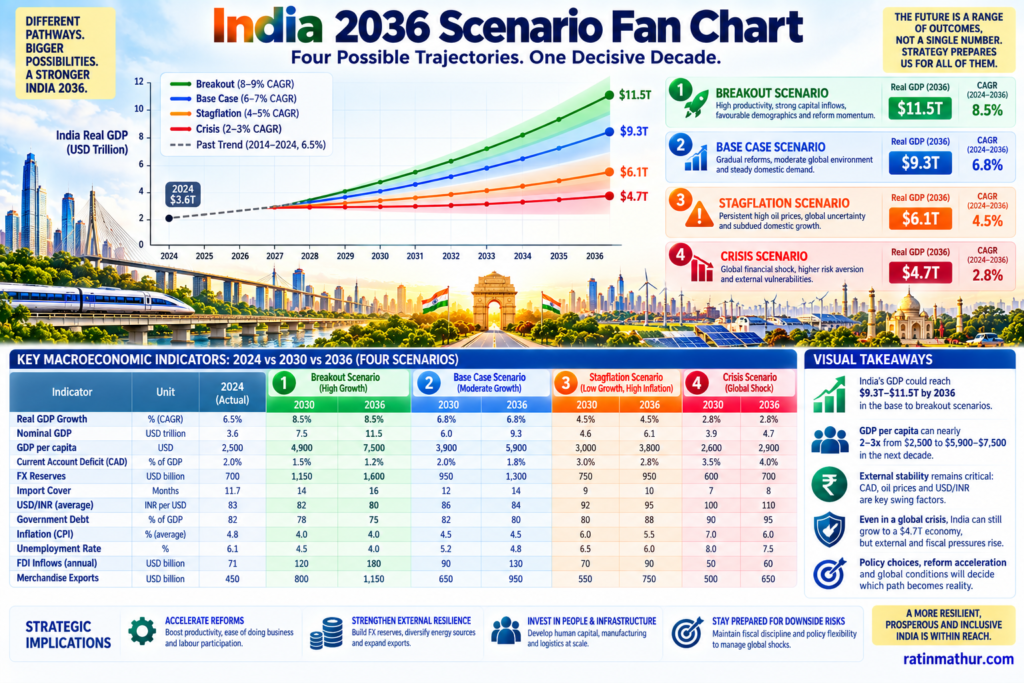
The 2026–2036 decade is likely to produce a world in which economic power becomes more distributed but financial power remains concentrated. The United States is likely to retain its technological and financial leadership, but its fiscal trajectory will increasingly influence global interest rates and capital allocation. China is likely to remain the world’s most important manufacturing power while dealing with slower growth and demographic contraction. Europe is likely to remain wealthy and institutionally powerful, but its relative economic weight will depend on whether productivity, energy security and defence investment improve. India has the strongest structural growth opportunity but also the largest requirement for economic transformation.
The most important conclusion is neither that the US is in inevitable decline nor that India is guaranteed to become a superpower. Both statements would be too simplistic. The more defensible conclusion is that the relative strengths of the four economies are becoming increasingly complementary and competitive at the same time.
America’s greatest asset is technology and financial depth. China’s is industrial scale. Europe’s is high-income institutional and industrial capacity. India’s is the combination of demographic scale, growth, services, domestic demand and the possibility of rapid productivity convergence.
For India, the next decade should be treated as a strategic window. The country does not need to eliminate every vulnerability before growing. It needs to ensure that the rate at which productive capacity, exports, reserves, productivity and employment improve is faster than the rate at which external vulnerabilities accumulate.
The strategic target for 2036 should therefore be broader than becoming the world’s third-largest economy. A stronger objective is to create an economy capable of sustaining 6–7% real growth while keeping inflation broadly contained, CAD below approximately 1.5% of GDP, investment around 33–36% of GDP, government debt on a declining trajectory, reserves near or above $1 trillion, FDI above the external financing gap, and manufacturing and high-value services exports expanding simultaneously.
The decisive variable will be productivity. Demography provides the workforce, capital provides the tools, infrastructure provides the platform, technology provides leverage and institutions determine whether these resources are converted into productive output. AI could become the multiplier across all five.
The central strategic message of this paper can therefore be stated simply: India’s opportunity in 2026–2036 is not to become less exposed to the world by retreating from it. It is to become so productive, diversified, financially resilient and globally integrated that external shocks increasingly become opportunities for relative gain rather than sources of systemic vulnerability.
If that transformation occurs, India could enter 2036 not merely as a larger economy, but as one of the world’s indispensable economic poles.
References
- Congressional Budget Office. (2026). The Budget and Economic Outlook: 2026 to 2036. Congressional Budget Office report
- Congressional Budget Office. (2026). How Changes in Economic Conditions Might Affect the Federal Budget, 2026 to 2036. CBO economic-sensitivity analysis
- International Monetary Fund. (2026). World Economic Outlook, April 2026: Global Economy in the Shadow of War. IMF World Economic Outlook April 2026
- International Monetary Fund. (2026). IMF DataMapper: India — World Economic Outlook April 2026. IMF India DataMapper
- International Monetary Fund. (2026). IMF DataMapper: United States — World Economic Outlook April 2026. IMF United States DataMapper
- International Monetary Fund. (2026). IMF DataMapper: China — World Economic Outlook April 2026. IMF China DataMapper
- International Monetary Fund. (2026). IMF DataMapper: European Union — World Economic Outlook April 2026. IMF European Union DataMapper
- Eurostat. (2026). Government debt at 88.9% of GDP in euro area; 82.9% of GDP in EU. Eurostat government debt statistics
- Government of India, Department of Economic Affairs. (2026). India’s External Debt as at end of December 2025. Government of India external debt report
- United Nations, Department of Economic and Social Affairs, Population Division. (2024). World Population Prospects 2024. United Nations World Population Prospects
Disclaimer
This article is intended for strategic research, educational and analytical purposes only. The 2026 macroeconomic figures are based principally on official sources cited above. The 2027–2036 scenarios, particularly those extending beyond the published horizon of official forecasts, are analytical model assumptions and should not be interpreted as official forecasts or guarantees. The proprietary frameworks and investment interpretations are conceptual decision-support tools and do not constitute investment, financial, legal, tax or policy advice. Actual economic and market outcomes may differ materially because of changes in fiscal policy, monetary policy, geopolitics, war, trade policy, commodity prices, technology, demographics, capital flows and other unforeseen developments. Investors and institutions should conduct their own due diligence and use current data before making investment or policy decisions.