Executive Summary
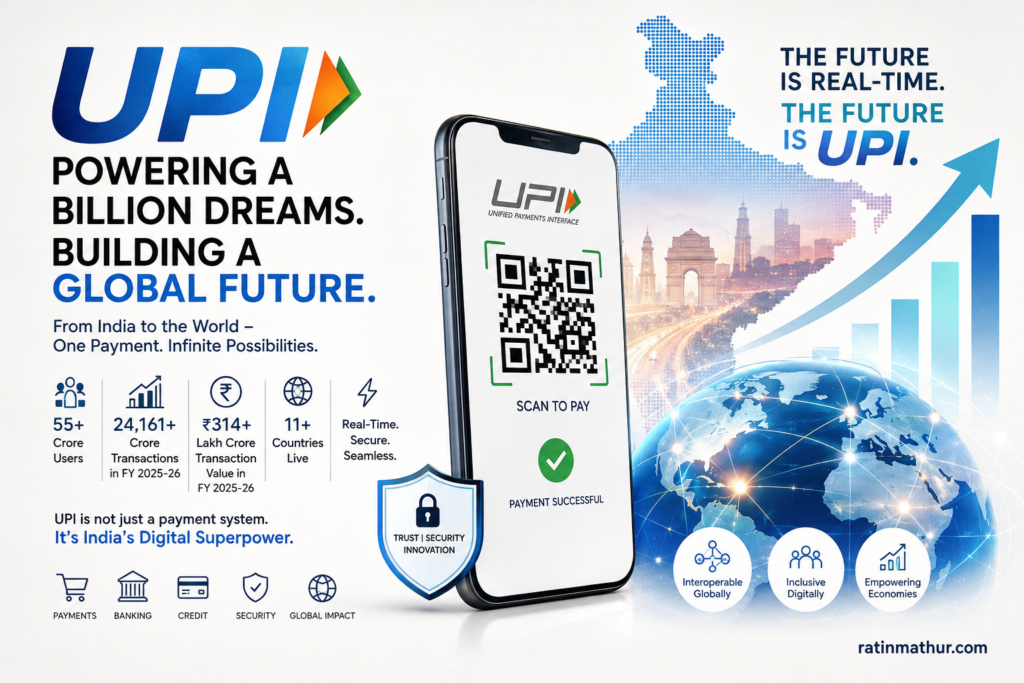
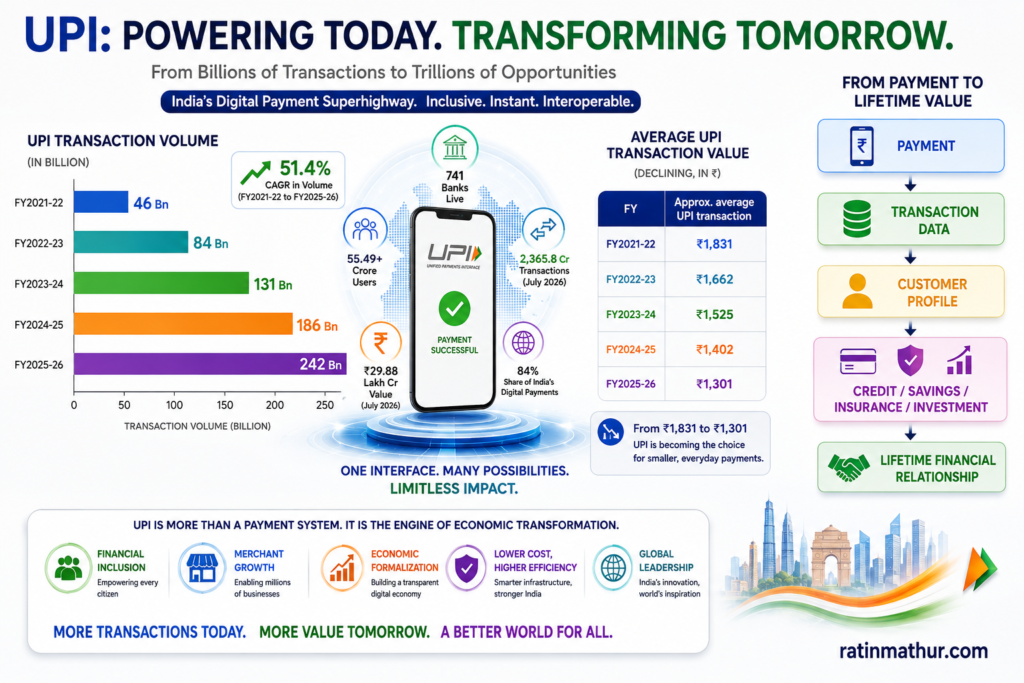
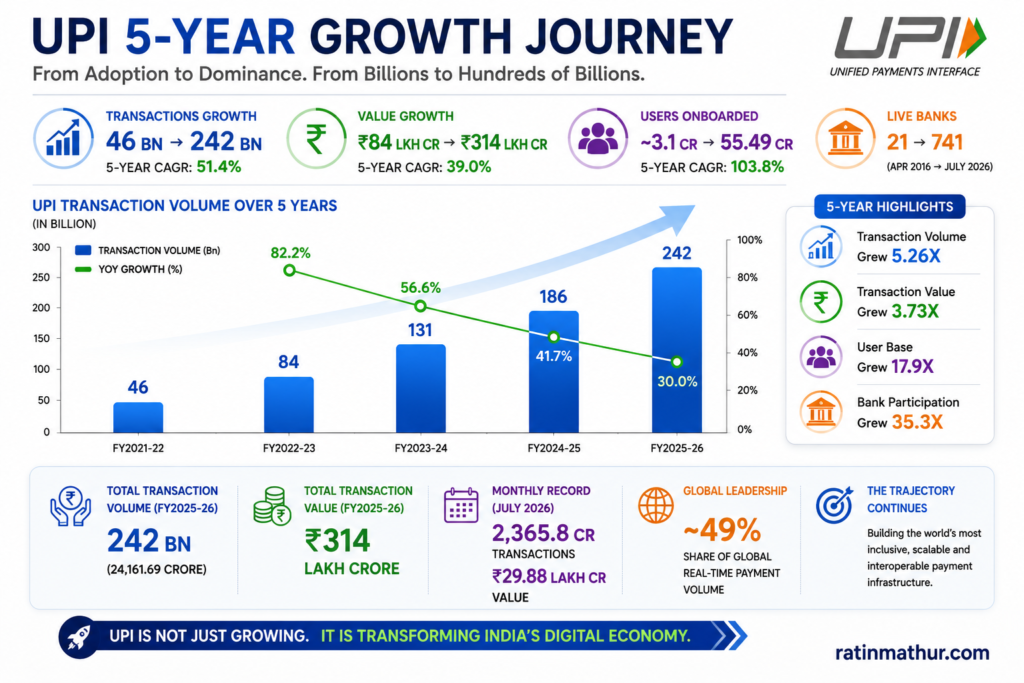
India’s Unified Payments Interface (UPI) has evolved from a digital payment innovation into a foundational layer of the country’s economic infrastructure. Launched in 2016 with 21 banks, UPI processed 24,161.69 crore transactions, equivalent to 241.62 billion transactions, valued at ₹314.23 lakh crore in FY2025-26. Annual transaction volume rose from 4,595.61 crore in FY2021-22 to 24,161.69 crore in FY2025-26, representing an approximately 51.4% compound annual growth rate (CAGR), while transaction value increased from ₹84.16 lakh crore to ₹314.23 lakh crore, representing approximately 39.0% CAGR. In July 2026 alone, UPI processed 2,365.8 crore transactions worth approximately ₹29.88 lakh crore through 741 live banks. UPI now represents about 84% of India’s digital payment transaction volume and approximately 49% of global real-time payment transaction volume.
| Indicator | FY2021-22 | FY2025-26 | Strategic Interpretation |
|---|---|---|---|
| UPI transaction volume | 4,595.61 crore | 24,161.69 crore | Massive behavioral adoption |
| UPI transaction value | ₹84.16 lakh crore | ₹314.23 lakh crore | Increasing economic significance |
| Volume CAGR | ~51.4% | Exceptional historical growth | |
| Value CAGR | ~39.0% | Strong but slower-value expansion | |
| UPI share of India’s digital payments | ~84% | Dominant domestic rail | |
| Live banks | 741 in July 2026 | Broad ecosystem participation | |
| Monthly transactions | 2,365.8 crore in July 2026 | Multi-billion daily-scale infrastructure | |
| Global real-time payment share | ~49% | Global leadership by transaction volume |
The most important strategic shift is that UPI is no longer primarily a mechanism for transferring money. It is becoming an interoperable transaction platform connecting consumers, merchants, banks, fintech companies, credit providers, government services and increasingly international payment networks. The International Monetary Fund has found that interoperability itself materially increased digital payment usage in India, demonstrating that network expansion does not require consolidation into a single proprietary platform.
The next phase of UPI will therefore be determined less by raw user acquisition and more by the expansion of transaction use cases, monetization around payments, embedded credit, AI-enabled payments, delegated payments, international interoperability, machine-to-machine transactions and trust architecture. PwC has identified a long-term trajectory toward as many as 2 billion UPI transactions per day by 2030, implying that resilience, observability and cybersecurity will become as strategically important as adoption.
This paper argues that UPI should be viewed as India’s strategic digital transaction infrastructure and, potentially, as one of the country’s most important technology exports. The central strategic question is no longer whether UPI can scale. It is whether India can convert that scale into sustainable economic value while preserving openness, resilience, affordability, security and global interoperability.
Introduction
India’s digital transformation has produced few technologies with the societal penetration and systemic impact of UPI. The innovation was deceptively simple: enable interoperable, instant, account-to-account payments through a standardized interface. Yet this simplicity masked a profound redesign of the payment ecosystem.
Traditional financial payments often required proprietary networks, card credentials, beneficiary registration or lengthy bank interfaces. UPI changed the user experience to one based on identifiers, QR codes, mobile applications, authentication and near-immediate confirmation. This reduced the cognitive and operational cost of making payments. The consequence was not merely greater adoption of electronic payments but a structural change in payment behavior.
UPI’s significance is amplified by its position within India’s Digital Public Infrastructure architecture. Aadhaar, bank-account penetration, mobile connectivity and interoperable payments created complementary layers that reinforced one another. The result was a system in which digital payments could move from urban convenience to mass-market utility. The IMF’s research provides particularly strong evidence of this phenomenon, estimating that interoperability increased overall digital payment usage by more than 50% in the year after integration in the studied Indian market context.
UPI has now reached a scale where its performance affects commerce, financial inclusion, fintech economics and broader economic formalization. In July 2026, it recorded its highest-ever monthly transaction volume of approximately 2,365.8 crore and value of ₹29.88 lakh crore, supported by 741 live banks.
The strategic importance of UPI, consequently, is much broader than the payments industry. It affects the competitiveness of banks, the economics of fintechs, the digitization of MSMEs, consumer behavior, cross-border commerce and India’s positioning as an exporter of digital public infrastructure.
Problem Statement & Objectives
UPI’s unprecedented success creates a paradox. The more successful the system becomes, the more difficult the next stage of growth becomes. Early-stage growth can be generated by adding users and merchants. At scale, incremental growth requires new use cases, stronger infrastructure, better economics, sophisticated risk management and international integration.
The problem is therefore no longer one of payment adoption. It is one of strategic scalability and value creation.
| Strategic Question | Core Issue |
|---|---|
| How much further can transaction volumes grow? | Growth will normalize from exceptionally high historical levels |
| How can UPI remain economically sustainable? | Very low payment pricing constrains direct monetization |
| How can the ecosystem manage systemic risk? | Scale increases the consequence of outages and fraud |
| What comes after payments? | Credit, commerce, investment, insurance and AI become potential extensions |
| Can UPI scale internationally? | Regulatory, currency, identity and settlement differences remain significant |
| Who captures value? | Payment providers may capture less value than adjacent financial-services providers |
The objective of this paper is to examine UPI as a strategic infrastructure phenomenon rather than as a payment product. It evaluates what UPI is, why it succeeded, how rapidly it has grown, what benefits it creates, where the structural constraints lie, how it is internationalizing, and what strategic pathways could define the next decade.
Methodology
This analysis combines official transaction statistics and policy information from the Government of India, Reserve Bank of India, National Payments Corporation of India and NPCI International Payments Limited, supplemented by IMF research and industry forecasts from PwC. Historical CAGR calculations in this paper are derived from official FY2021-22 and FY2025-26 transaction volumes and values. Forecast figures are scenario-based analytical estimates rather than official forecasts.
The assessment separates three categories of evidence: historical data, current observed developments and forward-looking scenarios. This distinction is important because UPI’s historical growth rate is unlikely to continue indefinitely as the underlying base becomes larger. The paper therefore uses a normalization approach for the FY2026-27 to FY2030-31 outlook rather than assuming that historical growth rates will persist unchanged.
Landscape Analysis
UPI has expanded from a relatively small banking initiative into a national transaction utility. The underlying scale increase is striking.
| Financial Year | Volume, crore | Volume, billion | YoY Growth | Value, ₹ lakh crore | YoY Value Growth |
|---|---|---|---|---|---|
| FY2021-22 | 4,595.61 | 45.96 | — | 84.16 | — |
| FY2022-23 | 8,371.44 | 83.71 | 82.2% | 139.15 | 65.3% |
| FY2023-24 | 13,112.95 | 131.13 | 56.6% | 199.95 | 43.7% |
| FY2024-25 | 18,586.60 | 185.87 | 41.7% | 260.56 | 30.3% |
| FY2025-26 | 24,161.69 | 241.62 | 30.0% | 314.23 | 20.6% |
Source: Government of India and NPCI data.
The pattern reveals a classic scale effect. Transaction volume remains exceptionally strong, but percentage growth has moderated from 82.2% in FY2022-23 to 30.0% in FY2025-26. This is not evidence of weakness. It is evidence that UPI has moved from hyper-growth toward mature-scale growth.
The average transaction value has also fallen over time, demonstrating that UPI is increasingly being used for lower-value and more frequent purchases rather than simply large peer-to-peer transfers. Based on annual transaction volume and value, the approximate average ticket declined from about ₹1,831 in FY2021-22 to approximately ₹1,301 in FY2025-26. The strategic interpretation is significant: digital payments are increasingly replacing cash at the smallest points of everyday economic activity.
The ecosystem is also becoming more commerce-centric. NPCI’s ecosystem statistics show substantial merchant-payment activity relative to peer-to-peer activity, reinforcing the interpretation that UPI has become a retail-commerce infrastructure rather than merely a money-transfer network.
UPI’s architecture further differentiates it from many proprietary payment ecosystems. A user’s bank relationship can be accessed through different participating applications, allowing competition at the customer-experience layer while retaining interoperability at the infrastructure layer. The IMF’s research suggests this design can enlarge effective network size without requiring market consolidation.
Key Findings
The first finding is that UPI’s greatest achievement is behavioral rather than technological. QR-based payments, mobile authentication and instant confirmation have transformed digital payments into an everyday habit. The declining average ticket size is evidence of this transformation because users increasingly deploy UPI for transactions that historically would have been completed with cash.
The second finding is that UPI has created a network effect at the system level. Conventional proprietary networks often become stronger as users consolidate on one platform. UPI demonstrates a different model: interoperability permits users and merchants connected to different applications and banks to transact with each other. This expands network utility without requiring a single private platform to own the entire ecosystem. The IMF found that this interoperability materially increased digital payment usage in India.
The third finding is that UPI is increasingly an economic infrastructure layer. In FY2025-26, it processed ₹314.23 lakh crore of transactions. In July 2026 alone, monthly transaction value reached approximately ₹29.88 lakh crore. At this scale, UPI performance influences retail commerce, liquidity flows, banking operations and the operating environment of millions of businesses.
The fourth finding is that the next growth engine is likely to shift from payments themselves toward services built around payments. UPI Lite, Hello! UPI, UPI Circle, Credit Line on UPI, RuPay Credit Card on UPI, AutoPay, international acceptance and emerging IoT functionality all indicate a broader strategic trajectory. NPCI describes Hello! UPI as a conversational interface designed to enable payments through regional-language voice interactions across smartphones, feature phones and IoT environments. NPCI’s UPI Circle framework has also been extended toward IoT devices and software profiles, including smart glasses, watches, televisions and AI profiles in controlled use cases.
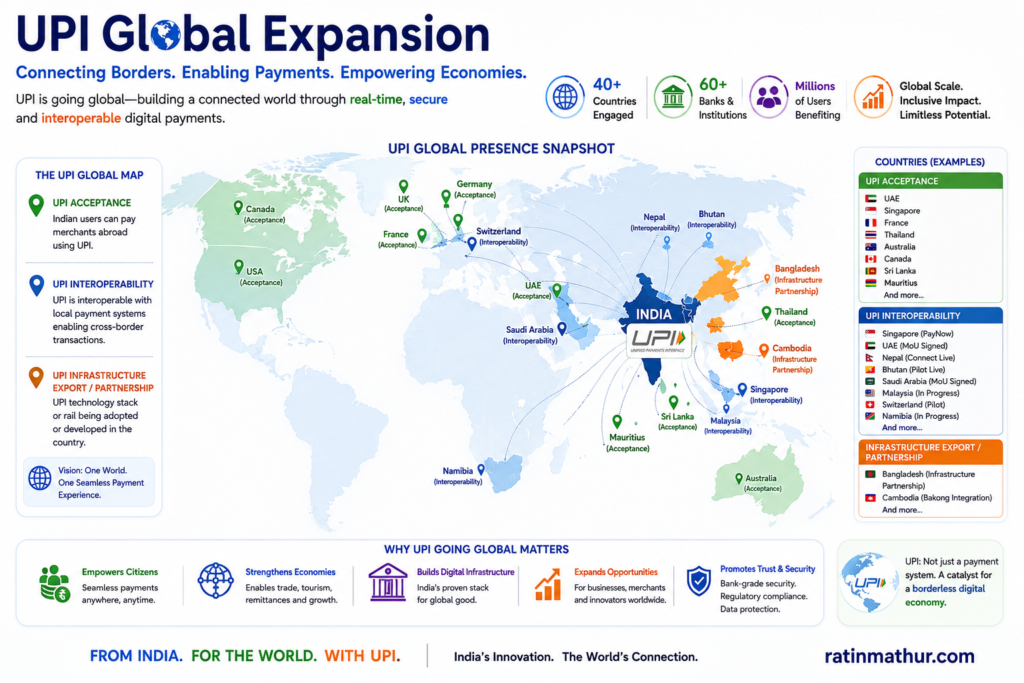
The fifth finding is that India has begun exporting not merely payment acceptance but payment infrastructure. NPCI International has built partnerships involving national and regional payment systems, while specific initiatives have addressed UPI-like infrastructure in markets such as Namibia, Peru and Trinidad and Tobago. NIPL’s international portfolio also includes UPI acceptance or interoperability initiatives involving markets such as Japan and Malaysia.
The sixth finding is that UPI’s strategic value is increasingly tied to trust. As daily volumes move toward hundreds of millions of transactions and potentially much higher levels, even small fraud rates or infrastructure disruptions can create large absolute impacts. NPCI’s 2026 circular environment reflects this emerging priority, with specific measures addressing information security, global acceptance, transaction controls and ecosystem governance.
Challenges & Opportunities
UPI’s principal challenge is that systemic importance increases faster than transaction economics. A low-cost or effectively free retail payment experience is highly desirable for consumers and merchants, but the infrastructure supporting hundreds of billions of transactions must continually fund cybersecurity, resilience, upgrades, reconciliation, fraud management and customer support.
A second challenge is concentration at the application layer. UPI may be interoperable structurally, but the consumer interface can become concentrated. This creates potential operational and competitive risk if a small number of applications account for a very large share of transactions. System-wide interoperability reduces some of the risk, but it does not eliminate the consequences of large application outages or concentration in user acquisition.
Cybersecurity is a third and increasingly important challenge. UPI’s convenience creates new attack surfaces around social engineering, fraudulent payment requests, malicious applications, account takeover, identity manipulation and transaction authorization. The strategic objective must therefore shift from transaction security to continuous trust architecture.
Infrastructure resilience represents a fourth challenge. PwC notes that UPI already operates at a daily volume above 0.6 billion transactions and identifies an ambition of 2 billion transactions per day by 2030. At such levels, observability, capacity management and end-to-end transaction monitoring become fundamental infrastructure requirements.
The opportunity side is considerably larger. Credit is perhaps the most important commercial extension. Credit Line on UPI enables pre-sanctioned bank credit lines to fund payments, potentially connecting transaction behavior with consumer and MSME financing. The value proposition shifts from “pay using your money” toward “transact using your available financial capacity.”
The second opportunity is internationalization. The Government of India reported that UPI was operational across 11 foreign countries by August 2026, while NIPL’s portfolio includes a broader pipeline of acceptance and infrastructure partnerships.
| UPI Opportunity | Potential Strategic Impact |
|---|---|
| Credit on UPI | Creates new financial-services economics |
| Cross-border payments | Reduces friction in tourism and remittances |
| UPI-like national infrastructure | Exports Indian digital public infrastructure |
| AI and voice payments | Expands accessibility and automation |
| IoT transactions | Enables machine-initiated commerce |
| MSME financial services | Links payments to credit, accounting and insurance |
| Recurring payments | Builds subscription and mandate ecosystems |
| Foreign visitor payments | Makes India more digitally accessible to international travelers |
Strategic Frameworks & Recommendations
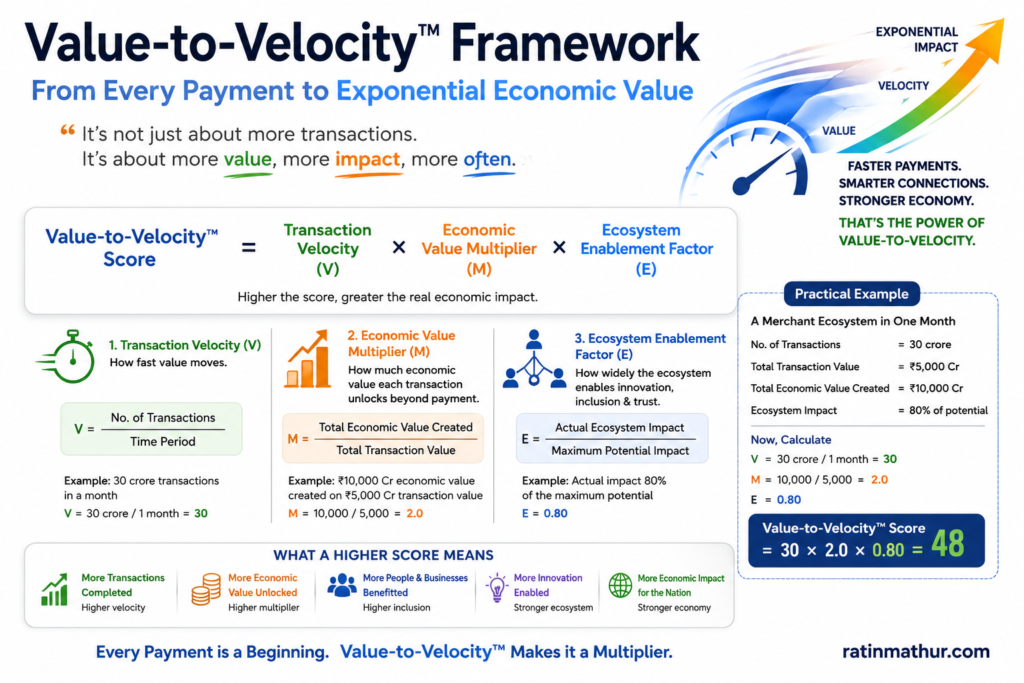
The Value-to-Velocity™ Framework
The Value-to-Velocity™ Framework proposes that the next phase of UPI should be measured not only by transaction value but by how quickly payment infrastructure converts a transaction into broader economic utility. The central proposition is that UPI creates maximum strategic value when payment velocity becomes the starting point for additional economic activity.
The first dimension is transaction velocity: the frequency, immediacy and reliability of payments. The second is economic value: the ability to convert transaction activity into commerce, credit, savings, insurance and investment. The third is ecosystem velocity: the speed with which banks, fintechs, merchants and technology companies can build new services on the UPI rail.
| Framework Layer | Strategic Question | Example |
|---|---|---|
| Velocity | How quickly and reliably can value move? | Instant QR payment |
| Value | What additional economic activity does the payment enable? | Merchant receives payment and becomes eligible for working capital |
| Ecosystem | How rapidly can new services be layered onto UPI? | Payment history supports a new financial product |
| Scale | Can the model operate economically at national volume? | Millions of small merchants transact daily |
Consider a small retailer receiving ₹20,000 of daily UPI payments. The transaction itself may generate little direct payment revenue, but the accumulated transaction history can potentially support digital accounting, cash-flow forecasting, working-capital eligibility, insurance products and tax-compliance services. Under this framework, the strategic value of UPI is therefore several times larger than the payment transaction itself.
The recommendation is that banks, fintechs and policymakers should track “value created per transaction” alongside “transactions processed.” The superior ecosystem will not necessarily be the one with the highest volume. It will be the one that converts transaction frequency into the highest sustainable economic utility without undermining affordability or privacy.
The Trust-to-Scale™ Framework
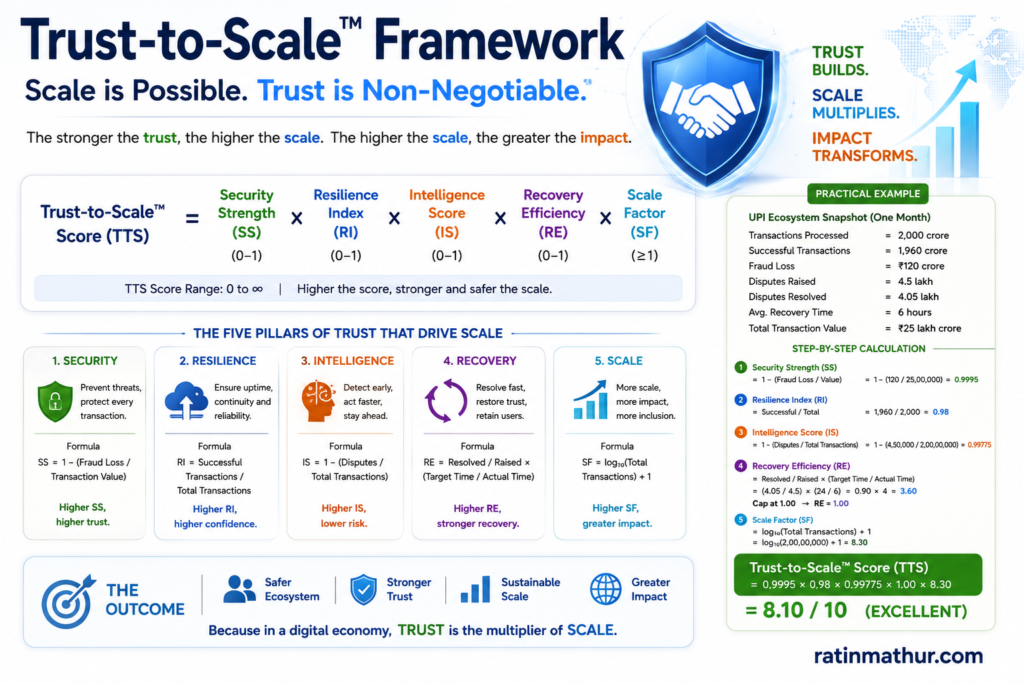
The Trust-to-Scale™ Framework argues that UPI’s next decade will be determined by the relationship between transaction scale and trust. As transaction volume increases, cybersecurity, fraud detection, availability, privacy and recovery mechanisms become strategic growth variables rather than compliance functions.
The framework contains four interconnected dimensions: security, resilience, intelligence and recovery. Security prevents attacks. Resilience keeps transactions available. Intelligence detects abnormal patterns. Recovery reduces the financial and reputational damage when controls fail.
| Trust Layer | Strategic Capability | Example |
|---|---|---|
| Security | Authentication and fraud prevention | Risk-based transaction controls |
| Resilience | High availability and observability | End-to-end transaction monitoring |
| Intelligence | Real-time anomaly detection | Detection of unusual transaction behavior |
| Recovery | Fast dispute and remediation mechanisms | Rapid response to unauthorized transactions |
| Governance | Ecosystem-wide accountability | Stronger security requirements for participants |
For example, a billion-transaction-a-day environment cannot rely solely on static transaction limits or periodic audits. It requires real-time risk intelligence capable of distinguishing normal low-value consumer activity from unusual account behavior, coordinated fraud patterns or compromised devices.
The strategic recommendation is to make “trust capacity” a formal infrastructure KPI. UPI growth should be evaluated alongside fraud loss rates, transaction-success rates, recovery times, system availability, latency and security-event response time. This framework also supports the policy principle that innovation and security should not be treated as competing objectives. Security becomes an enabler of scale.
The Global Interoperability Flywheel™ Framework
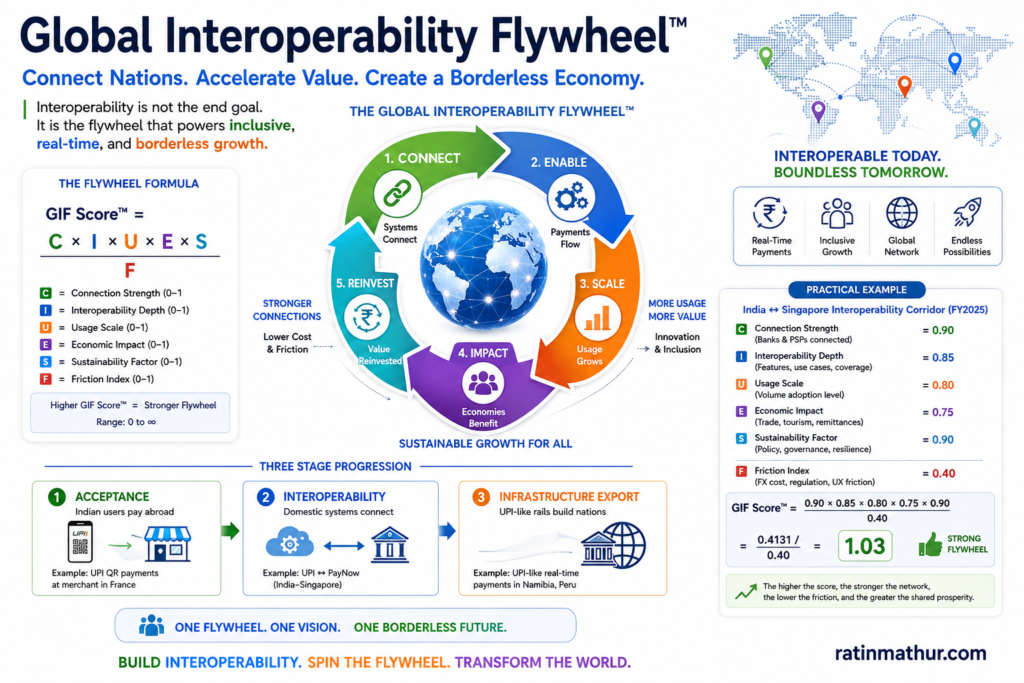
The Global Interoperability Flywheel™ Framework positions UPI internationalization as a three-stage strategic progression: acceptance, interoperability and infrastructure export. The first stage allows Indian consumers to pay internationally. The second connects UPI with foreign payment systems. The third helps countries build or modernize national real-time payment infrastructure using UPI-derived architecture and expertise.
| Stage | Strategic Model | Example |
|---|---|---|
| Acceptance | Indian users pay overseas | UPI merchant acceptance |
| Interoperability | Domestic systems connect | UPI and PayNow-style linkage |
| Infrastructure export | UPI-like national architecture | Namibia or Peru initiatives |
| Ecosystem integration | Payment connects to broader finance | Cross-border commerce and remittances |
This framework changes the strategic definition of international success. The objective should not simply be to maximize the number of countries where an Indian traveler can scan a UPI QR code. The higher-value objective is to create interoperable corridors in which payments, remittances and eventually financial services can move efficiently between national systems.
Japan illustrates the acceptance opportunity. In 2025, NIPL and NTT DATA Japan signed an MoU to assess and work toward enabling UPI acceptance across NTT DATA-acquired merchant locations in Japan. Malaysia illustrates the interoperability model through work between NIPL and Payments Network Malaysia toward UPI and DuitNow acceptance. Namibia, Peru and Trinidad and Tobago illustrate the infrastructure-export pathway.
The recommendation is to treat each international corridor as a strategic economic network rather than a payment partnership. The assessment should include tourism, bilateral trade, remittances, FX economics, financial inclusion, national payment sovereignty and data governance. The ultimate prize is not foreign acceptance alone. It is the creation of an interconnected real-time payment ecosystem in which India becomes a major architectural and interoperability hub.
Future Outlook & Conclusion
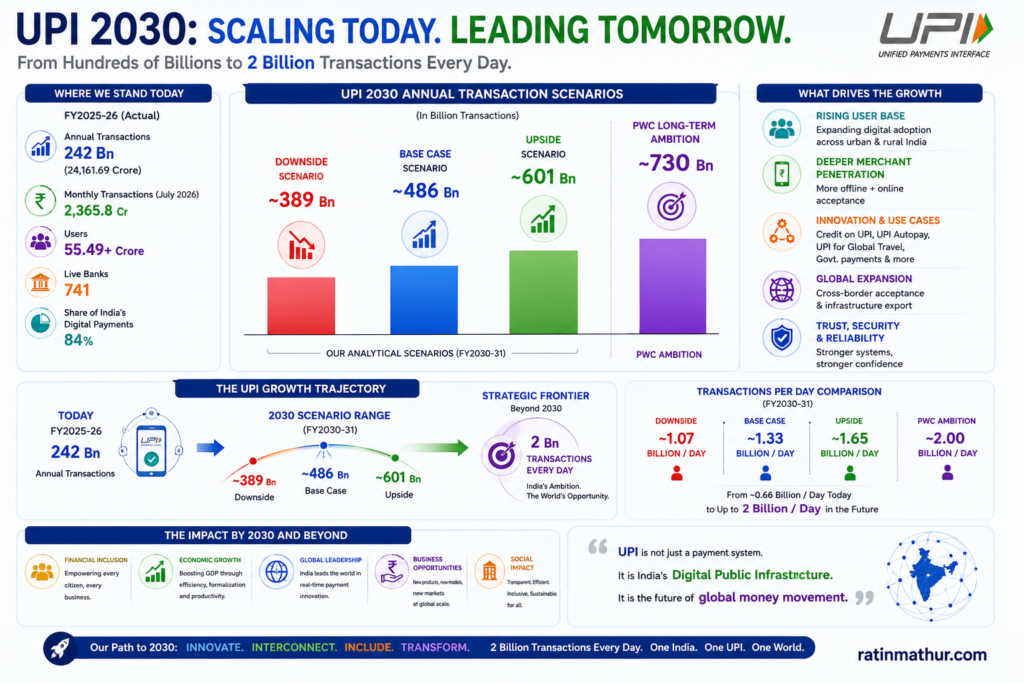
UPI is entering its second decade at a dramatically different scale from the one in which it began. FY2025-26 delivered 241.62 billion annual transactions, while July 2026 established a monthly record of approximately 23.66 billion transactions. The system already represents about 49% of global real-time payment volume.
The next five years are likely to produce slower percentage growth but substantially greater absolute scale.
| Scenario | Approx. Volume CAGR | FY2030-31 Annual Volume | Approx. Value CAGR | FY2030-31 Value |
|---|---|---|---|---|
| Downside | 10% | ~389 billion | 8% | ~₹462 trillion |
| Base case | 15% | ~486 billion | 12% | ~₹554 trillion |
| Upside | 20% | ~601 billion | 15% | ~₹632 trillion |
These estimates are analytical scenarios rather than official forecasts. They assume that user penetration continues, merchant payments deepen, average ticket size remains under pressure, credit-related use cases expand, infrastructure reliability improves and international transactions gradually become more important. They also recognize that extrapolating UPI’s historic 51% volume CAGR into the next decade would be unrealistic.
PwC’s long-term infrastructure assessment is more ambitious, pointing to an objective of approximately 2 billion UPI transactions per day by 2030. Whether that threshold is reached is less important strategically than what it represents: the next generation of UPI will require infrastructure designed for extreme scale.
The more consequential transformation, however, will occur beyond payment volume. UPI is becoming an interface between money and economic activity. Credit, subscriptions, insurance, wealth management, MSME finance, international payments, voice interfaces, delegated payments and IoT transactions can all exist around the core payment rail. NPCI’s evolution of UPI Lite, Hello! UPI and UPI Circle demonstrates that the system is already moving in this direction.
The central strategic conclusion is therefore clear: UPI should not be judged primarily as a payment product. It should be evaluated as digital economic infrastructure.
India’s competitive advantage is now extending beyond software services and digital consumer platforms toward infrastructure that enables transactions themselves. If India can maintain interoperability, trust, affordability, resilience and regulatory adaptability while exporting its real-time-payment expertise, UPI could become one of the most influential components of India’s Digital Public Infrastructure model globally.
The first decade of UPI was about making payments digital.
The next decade will be about making the economy programmable, interoperable and increasingly real-time.
That is the larger strategic significance of UPI.
References
- Government of India, Press Information Bureau. (2026, July 20). Nearly 55.49 Crore Users Onboarded on UPI as in June 2026: UPI transactions grow 24,162 Cr in Volume and 314 lakh Cr in Value in FY 2025-26. Ministry of Finance. https://www.pib.gov.in/PressReleasePage.aspx?PRID=2286608
- Government of India, Press Information Bureau. (2026, August). UPI decade and July 2026 transaction statistics. Ministry of Finance. https://www.pib.gov.in/PressReleasePage.aspx?PRID=2298306
- Government of India, Press Information Bureau. (2026, August). UPI global footprint and digital payments factsheet. https://www.pib.gov.in/FactsheetDetails.aspx?ModuleId=16&NoteId=150962
- International Monetary Fund. (2025). Integrating fragmented networks: Interoperability in money and payments. IMF Working Paper 2025/126. https://www.elibrary.imf.org/view/journals/001/2025/126/article-A000-en.xml
- National Payments Corporation of India. (2026). UPI ecosystem and product information. https://www.npci.org.in/product/upi
- National Payments Corporation of India. (2026). Hello! UPI: Conversational payments on UPI. https://www.npci.org.in/product/upi/hello-upi
- National Payments Corporation of India. (2026). UPI Lite. https://www.npci.org.in/product/upi/upi-lite
- National Payments Corporation of India. (2026). Unified Payments Interface circulars and operating framework. https://www.npci.org.in/circulars/upi
- NPCI International Payments Limited. (2026). International UPI partnerships and press releases. https://www.nipl.com/media-and-coverage/press-releases
- NPCI International Payments Limited. (2025, October 14). NPCI International signs MoU with NTT DATA Japan for UPI acceptance in Japan. https://www.nipl.com/uploads/NPCI_International_signs_Mo_U_with_NTT_DATA_Japan_to_enable_UPI_acceptance_at_merchant_locations_in_Japan_14_Oct_002_a292d8d769.pdf
- NPCI International Payments Limited. (2026). Infrastructure build: UPI-like real-time payments infrastructure. https://www.nipl.com/how-it-works/infrastructure-build/upi-like
- PwC India. (2025). Indian payments handbook 2025-2030. https://www.pwc.in/assets/pdfs/indian-payments-handbook-2025-2030.pdf
Disclaimer
This article is an independent strategic analysis prepared for informational, educational and thought-leadership purposes. Historical statistics are derived from publicly available information published by Government of India agencies, RBI, NPCI, NPCI International, IMF and other cited sources. Forward-looking estimates and strategic interpretations are analytical scenarios and should not be treated as official forecasts, investment advice, business guarantees or regulatory guidance. Actual UPI transaction growth, international adoption, technology deployment, monetization, cybersecurity risk and market outcomes may differ materially from the scenarios presented. Readers should conduct independent due diligence before making investment, commercial, policy or strategic decisions.