Executive Summary
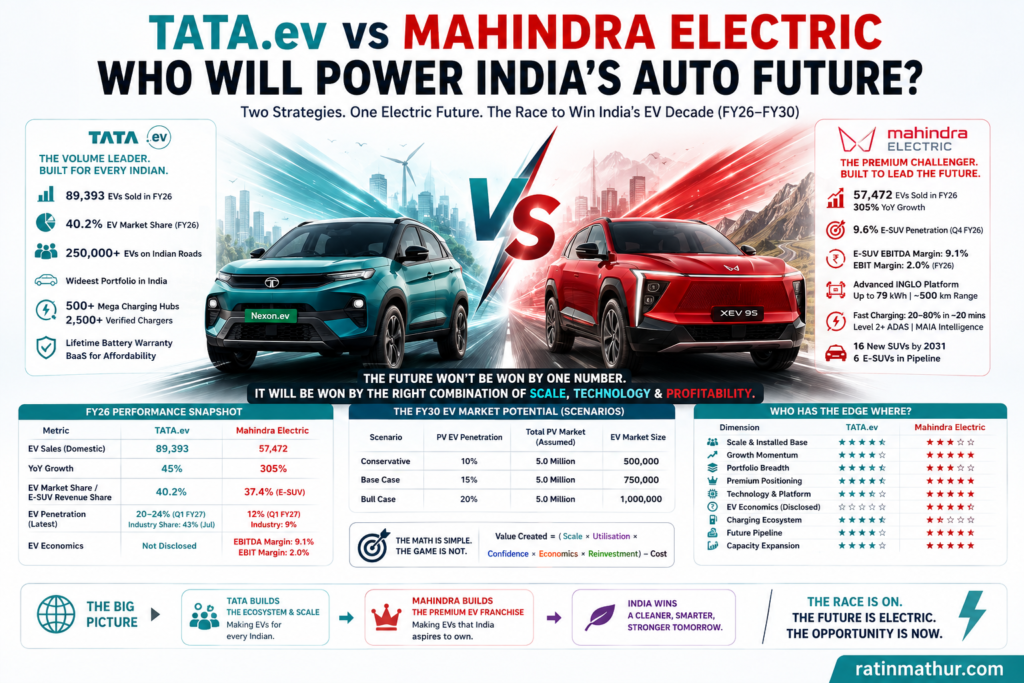
India’s electric passenger-vehicle market has entered a new phase. The question is no longer whether electric cars will matter; it is increasingly about which Indian manufacturer can convert EV adoption into durable market leadership, superior customer economics and profitable scale. In that contest, Tata.ev and Mahindra represent two distinctly different strategies. Tata has built the larger installed base, broader portfolio and stronger charging ecosystem. Mahindra has built a rapidly scaling, technology-led electric-SUV proposition with unusually early evidence of profitability. The strategic battle is therefore not simply between the current leader and challenger; it is between two competing models for winning the next stage of electrification.
The FY26 evidence establishes Tata as the current volume leader. Tata Passenger Vehicles sold 89,393 domestic EVs, up 45% year on year, and reported a 40.2% EV market share. It had crossed 250,000 cumulative EV sales and described its portfolio as the widest in India. Mahindra, by contrast, sold 57,472 electric four-wheelers in FY26, compared with 14,183 a year earlier, representing 305.2% growth. Its E-SUV penetration reached 9.6% in Q4 FY26, while E-SUVs generated an end-to-end EBITDA margin of 9.1% and EBIT margin of 2.0% in their first full year of operations.
The more revealing evidence comes from FY27. Tata reported more than 34,000 EVs in Q1 FY27, approximately 20% of its sales, rising to 24% in July, while July EV market share reached 43%. Mahindra reported EV penetration of 12% against 9% for the industry, cumulative EV sales of 77,000, and 77% year-on-year growth in EV-SUV volumes.
The strategic conclusion is consequently nuanced. Tata is the stronger current EV franchise; Mahindra is the stronger emerging EV-SUV challenger. Tata has the advantage in scale, breadth, installed base and charging infrastructure. Mahindra has the advantage in premiumisation, SUV alignment, technology differentiation, product momentum and disclosed EV economics. The decisive question for the next three to five years is whether Mahindra can sustain high growth as its base expands while Tata converts its scale advantage into structurally stronger EV profitability.
Introduction
The Indian passenger-vehicle industry is undergoing a simultaneous transformation in technology, consumer preferences and competitive structure. FY26 passenger-vehicle EV sales reached approximately 1.6 lakh units, with EV penetration at 3.4%, according to Mahindra’s FY26 annual report. The same report identifies government electrification policies, domestic manufacturing incentives, rising technology expectations and increasing consumer adoption as structural drivers of the transition.
The transition is accelerating. Tata’s Q1 FY27 management commentary reported that EVs were the fastest-growing powertrain in the passenger-vehicle industry, with 77% year-on-year growth and industry penetration reaching 8% by June 2026. This represents a critical inflection point. When adoption moves from an emerging niche toward mainstream consideration, competitive advantage increasingly shifts from first-mover status toward portfolio quality, cost structure, charging confidence, brand desirability, manufacturing scale and customer experience.
This is precisely why Tata and Mahindra deserve a focused comparison. Both are Indian manufacturers with significant domestic passenger-vehicle ambitions, but their EV strategies differ fundamentally. Tata has pursued broad-based electrification across price points and body styles, seeking to mainstream EV ownership. Mahindra has concentrated on electric SUVs, seeking to combine premiumisation, technology and profitability.
The comparison in this article is deliberately restricted to Indian passenger-vehicle EVs. Commercial vehicles, electric three-wheelers, tractors, Jaguar Land Rover and other unrelated businesses are excluded. This creates a more meaningful strategic comparison between Tata.ev and Mahindra’s electric passenger-vehicle business.
Problem Statement & Objectives
The central strategic problem can be stated as follows: Which of Tata.ev and Mahindra Electric is better positioned to achieve sustainable leadership in India’s passenger EV market through FY30, considering scale, growth, product competitiveness, economics, ecosystem strength and capacity to scale?
The objective is not simply to identify today’s market leader. A historical comparison would produce an obvious answer because Tata entered the market earlier and has accumulated a much larger installed base. The more valuable strategic question is whether that advantage will remain decisive as competition intensifies and whether Mahindra’s rapidly expanding electric-SUV proposition can alter the market structure.
The assessment therefore separates current position from future potential and volume leadership from economic value creation.
| Strategic dimension | Question being tested |
|---|---|
| Scale | Who has the stronger current EV volume and installed-base advantage? |
| Growth | Who is gaining momentum faster? |
| Product | Which portfolio better addresses emerging Indian EV demand? |
| Technology | Which company offers greater differentiation in EV architecture and software? |
| Economics | Which company has stronger evidence of sustainable EV profitability? |
| Ecosystem | Which company reduces charging, ownership and adoption barriers more effectively? |
| Scalability | Which company is better positioned to translate demand into future volume? |
| Strategic position | Who has the stronger right to win by FY30? |
Methodology
The analysis follows a structured seven-step consulting approach: defining the business problem, structuring the problem into mutually exclusive dimensions, prioritising the issues, developing hypotheses and an analysis plan, testing those hypotheses using evidence, synthesising the findings into strategic implications, and translating those implications into recommendations. This prevents the analysis from jumping directly from company performance to a conclusion.
The primary evidence base comprises the FY26 integrated annual reports of Tata Motors Passenger Vehicles and Mahindra & Mahindra and the Q1 FY27 management commentary of both companies. Current official company information has also been used to verify product and ecosystem developments. Where the companies disclose different definitions, such as Tata’s EV market share based on Vahan registrations and Mahindra’s E-SUV revenue market share based on JATO, the measures are not treated as directly interchangeable.
| Evidence classification | Meaning in this analysis |
|---|---|
| Fact | Directly disclosed by a company or authoritative source |
| Data | Quantitative company or industry information |
| Assumption | Analytical input used to explore a future scenario |
| Hypothesis | Proposition requiring evidence |
| Analysis | Interpretation of the evidence |
| Insight | Strategic meaning derived from the analysis |
| Implication | What management should do differently |
| Recommendation | Action arising from the evidence and implication |
Landscape Analysis
India’s EV market is moving from an early-adopter phase toward mainstream adoption. FY26 PV-EV sales reached about 1.6 lakh units, up 93.9%, although penetration remained only 3.4%. Tata’s FY26 report similarly describes an EV market growing by more than 80%, driven by wider OEM participation, new launches and improving consumer sentiment.
The competitive landscape is also changing because consumers increasingly expect EVs to deliver more than environmental benefits. Range, charging speed, safety, design, software, performance, battery assurance and financing are becoming integral to the purchase decision. Tata’s FY26 strategy explicitly focused on affordability, range confidence and battery assurance, while Mahindra has positioned its electric SUVs around technology, performance, design and software.
An important structural trend favours Mahindra. Utility vehicles have become the dominant form factor in Indian passenger vehicles. Mahindra reports that UV share increased from 21% in FY16 to 66.9% in FY26, with UVs growing at an 18.1% CAGR compared with 5.2% for overall passenger vehicles. This means the EV transition is increasingly occurring inside a market already shifting toward SUVs, exactly where Mahindra possesses its strongest brand and product credentials.
Tata, however, possesses a different structural advantage. Its EV portfolio spans multiple body styles and price points and includes Tiago.ev, Punch.ev, Nexon.ev, Curvv.ev, Harrier.ev and Sierra.ev. Its official EV platform currently presents this breadth explicitly, reinforcing Tata’s strategy of making EVs accessible across segments. TATA.ev official electric-vehicle portfolio
The ecosystem dimension is equally important. Tata reported more than 250,000 EVs on Indian roads and an ecosystem encompassing more than 200 Mega Charging Hubs, more than 2,500 verified chargers, access to more than 30,000 chargers through its platform and more than 200,000 home chargers. Mahindra is expanding its Charge_iN network, but its ecosystem is still at a substantially earlier stage.
Key Findings
The first major finding is that Tata owns the current EV scale advantage. Its FY26 domestic EV wholesale volume of 89,393 was 45% higher than FY25 and represented a 40.2% market share. This is not merely a quarterly lead. Tata has accumulated more than 250,000 EVs on Indian roads, creating an installed-base advantage that supports customer confidence, service learning, residual-value familiarity and ecosystem utilisation.
The second finding is that Mahindra owns the stronger growth trajectory. Its electric four-wheeler sales increased from 14,183 to 57,472 in FY26, a 305.2% increase. The growth rate should not be interpreted mechanically because Mahindra is scaling from a much smaller base. Nevertheless, the direction is strategically significant because it demonstrates that the company has found product-market fit for its new electric-SUV proposition.
The third finding is that Tata’s competitive advantage is breadth whereas Mahindra’s is depth. Tata is attempting to mainstream EVs by offering products across price points, body styles and use cases. Mahindra is concentrating on electric SUVs and using that focus to create a more premium proposition. This is a fundamental strategic difference rather than merely a difference in model count.
The fourth finding is that Mahindra has stronger disclosed evidence of EV economics. Its E-SUV business achieved 9.1% EBITDA and 2.0% EBIT margins in its first full year, including contract manufacturing. Tata does not disclose a directly comparable standalone EV EBITDA or EBIT number in the supplied FY26 material. Tata’s overall PV EBITDA margin was 6.9%, but that figure combines ICE and EV products and therefore cannot be used to infer standalone EV profitability.
The fifth finding is that Mahindra’s EV proposition is strategically aligned with India’s SUV transition. Its INGLO electric architecture and MAIA intelligence layer underpin a premium product strategy, while the XEV 9S offers battery configurations of 59 kWh, 70 kWh and 79 kWh alongside advanced software and driver-assistance features. This gives Mahindra a credible route to premiumisation rather than merely electrification.
The sixth finding is that Tata’s ecosystem remains a formidable moat. Charging confidence is one of the biggest barriers to mainstream EV adoption, and Tata has spent years building infrastructure, partnerships and customer support around the vehicle itself. Its 2026 strategy included 200-plus Mega Charging Hubs, 2,500-plus verified chargers, access to 30,000-plus chargers and more than 200,000 home chargers. Mahindra’s charging network is expanding, but the installed-base gap means it cannot easily replicate Tata’s ecosystem overnight.
The seventh finding is that the gap is narrowing faster than the current market-share numbers suggest. Tata reported more than 34,000 EVs in Q1 FY27, with EVs accounting for roughly 20% of its sales and 24% in July; July EV market share reached 43%. Mahindra reported EV penetration of 12% against 9% for the industry, 77% growth in EV-SUV volumes and cumulative EV sales of 77,000. Tata therefore remains ahead, but Mahindra is building a credible challenger position at increasing speed.
| Finding | Tata.ev | Mahindra Electric | Strategic interpretation |
|---|---|---|---|
| Current scale | Clear leader | Smaller base | Tata has the installed-base moat |
| Growth | Strong | Exceptional | Mahindra has the momentum advantage |
| Portfolio | Broad | Focused | Tata targets mainstream scale; Mahindra targets SUV depth |
| EV economics | Not separately disclosed | Positive disclosed margins | Mahindra has stronger visible economics |
| Charging | Large ecosystem | Scaling | Tata has the stronger adoption moat |
| SUV alignment | Strong | Core competence | Structural advantage for Mahindra |
| Technology | Increasingly advanced | Highly differentiated | Mahindra has stronger premium technology positioning |
| Future challenge | Monetise scale | Sustain growth | Both face different execution tests |
Challenges & Opportunities
Tata’s central challenge is no longer proving that Indians will buy electric cars. It is converting its first-mover scale into durable profitability while defending market share against increasingly sophisticated competitors. Its FY26 EV market share was 40.2%, down from 55.4% the previous year, demonstrating that the category is becoming substantially more competitive even as Tata’s absolute EV volumes grow.
Tata’s opportunity is to exploit its installed base as a strategic asset rather than treating it simply as historical sales. Every additional vehicle adds customer experience, service data, ecosystem utilisation and brand familiarity. The opportunity is to make that installed base increasingly difficult for competitors to displace.
Mahindra’s central challenge is the opposite. It has demonstrated product-market fit and attractive initial economics, but it must prove that its growth can survive a larger base. Growing 305% from 14,183 vehicles is not equivalent to growing 30% from 100,000 vehicles. The next stage will test manufacturing scalability, battery sourcing, service capability, charging access and brand acceptance beyond the premium SUV early-adopter segment.
Mahindra’s opportunity is substantial because the SUV market is structurally expanding. If the future Indian EV customer increasingly prefers larger, safer, technology-rich SUVs, Mahindra’s core brand position becomes a strategic asset rather than merely a historical strength.
The most important uncertainty is therefore not whether one company can win. It is whether the market becomes large enough for both strategies to coexist profitably. India’s EV market could expand several-fold by FY30, but the precise penetration rate and total market volume remain uncertain. Any numerical FY30 forecast should therefore be treated as a scenario rather than a fact.
Strategic Frameworks & Recommendations
EV Scale-to-Value Flywheel™
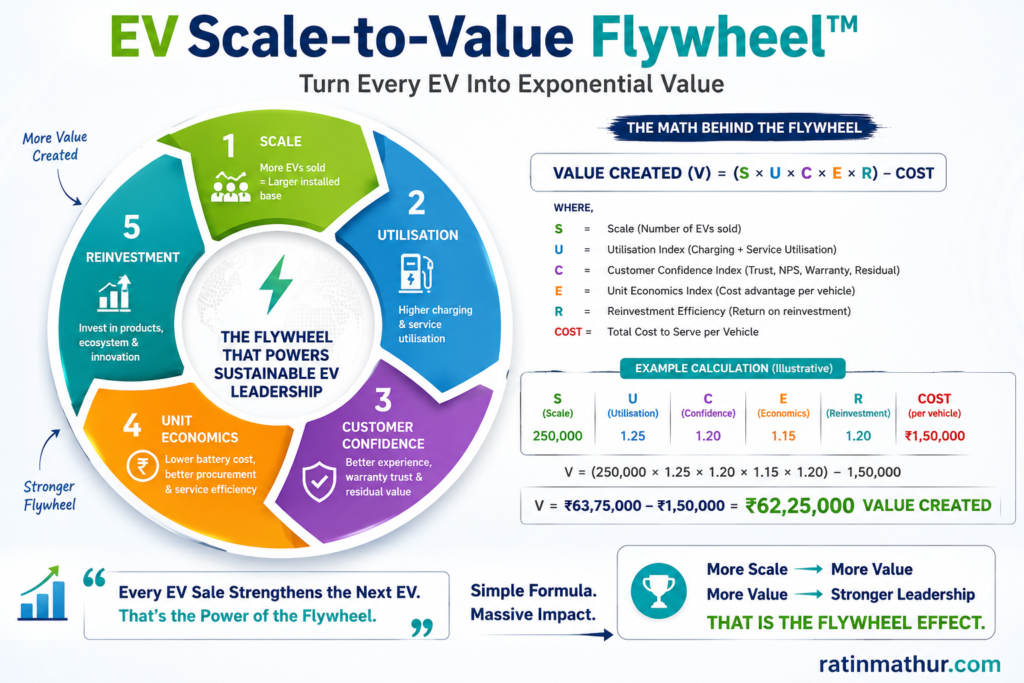
The EV Scale-to-Value Flywheel™ is designed to answer the central strategic question facing both companies: how can EV volume be converted into sustainable economic advantage rather than becoming a race for low-margin units? The framework links five variables in a reinforcing cycle: volume, utilisation, customer confidence, unit economics and reinvestment. The strategic principle is that scale becomes valuable only when each additional vehicle strengthens the economics of the next vehicle.
For Tata, the framework implies that its 250,000-plus installed base should be treated as a strategic asset. The company should use scale to lower battery and component costs, increase charging utilisation, deepen customer analytics, improve residual-value confidence and strengthen after-sales economics. Mahindra should use the same framework differently: its objective should be to protect the early positive economics of E-SUVs while progressively increasing volume. The danger for Mahindra would be pursuing volume at the expense of premium positioning; the danger for Tata would be pursuing market share without sufficiently improving EV-specific returns.
| EV Scale-to-Value Flywheel™ | Tata strategic application | Mahindra strategic application |
|---|---|---|
| Scale | Monetise 250,000-plus installed base | Rapidly increase E-SUV volume |
| Utilisation | Increase charging and service utilisation | Build charging and service density around SUV corridors |
| Customer confidence | Leverage warranty, ecosystem and ownership data | Build premium ownership assurance |
| Unit economics | Convert scale into battery, procurement and service savings | Protect 9.1% EBITDA starting economics |
| Reinvestment | Fund broader EV portfolio and ecosystem | Fund next-generation E-SUVs and capacity |
| Strategic objective | Scale with margin | Grow without diluting premium economics |
The practical example is the difference between selling another EV and creating another profitable node in the ecosystem. Tata’s next 100,000 EVs should not merely increase volume; they should increase charging utilisation, service efficiency, customer data and procurement leverage. Mahindra’s next 100,000 should similarly increase platform utilisation and purchasing leverage while maintaining the premium price-value proposition that generated its initial margin advantage. The framework therefore changes the management question from “How many EVs can we sell?” to “What economic flywheel does every EV sale strengthen?”
EV Portfolio-Positioning Architecture™
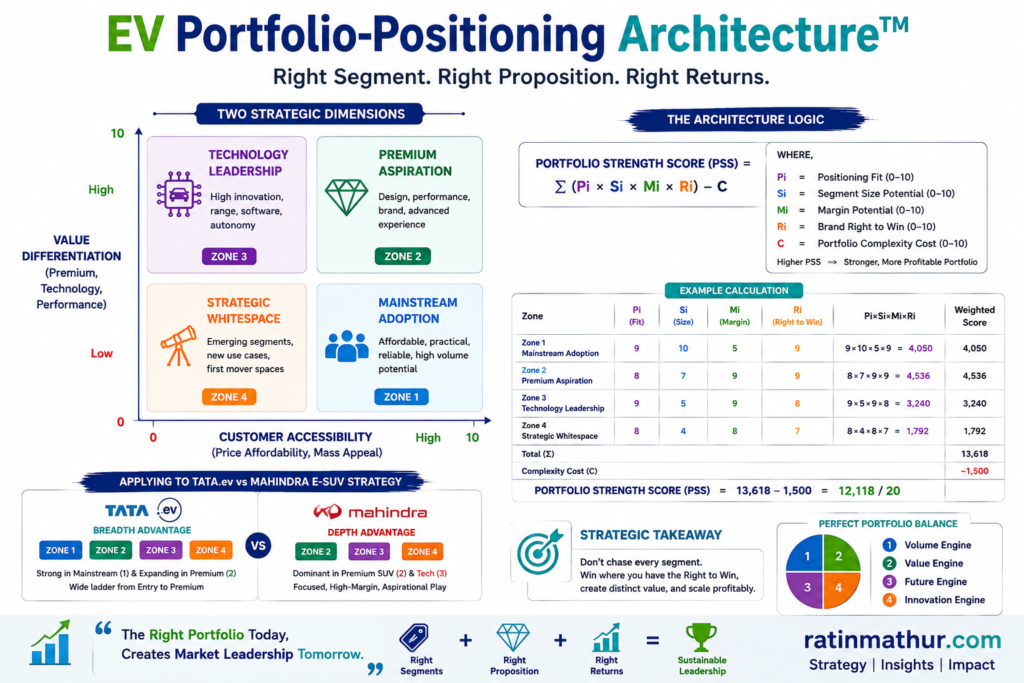
The EV Portfolio-Positioning Architecture™ addresses a second strategic challenge: how should each company decide where to compete as India’s EV market fragments across price, body style, range and customer use case? The framework uses two strategic dimensions, customer accessibility and value differentiation, to identify four portfolio zones: mainstream adoption, premium aspiration, technology leadership and strategic whitespace. The objective is not to maximise the number of models but to ensure that every model has a distinct strategic role.
Tata’s natural advantage lies in mainstream adoption because its portfolio spans multiple price points and body styles. Mahindra’s natural advantage lies in premium aspiration and SUV-led technology. The strategic mistake for either company would be to imitate the other without preserving its own right to win. Tata should not abandon breadth merely to chase premium SUVs, while Mahindra should not dilute its differentiated SUV identity by attempting to cover every entry-level EV segment.
| Portfolio zone | Customer proposition | Tata role | Mahindra role |
|---|---|---|---|
| Mainstream adoption | Affordable, practical, trusted | Core strategic territory | Selective participation |
| Premium aspiration | Design, performance, status | Expand selectively | Core strategic territory |
| Technology leadership | Range, software, ADAS, performance | Build through higher-end models | Core strategic territory |
| Strategic whitespace | New use cases and emerging segments | Use portfolio breadth | Use SUV architecture and platforms |
A practical example is Tata’s progression from Tiago.ev and Punch.ev toward Nexon.ev, Curvv.ev, Harrier.ev and Sierra.ev. This allows the company to move customers upward through an EV ownership ladder. Mahindra’s example is different: BE 6, XEV 9e and XEV 9S establish a premium electric-SUV family around a common technological proposition. The strategic recommendation is therefore to manage the portfolio as an architecture rather than as a collection of individual models. Each launch should have a defined role in acquiring customers, moving customers upward, defending a segment or creating a new segment.
Charging-to-Conversion Moat™
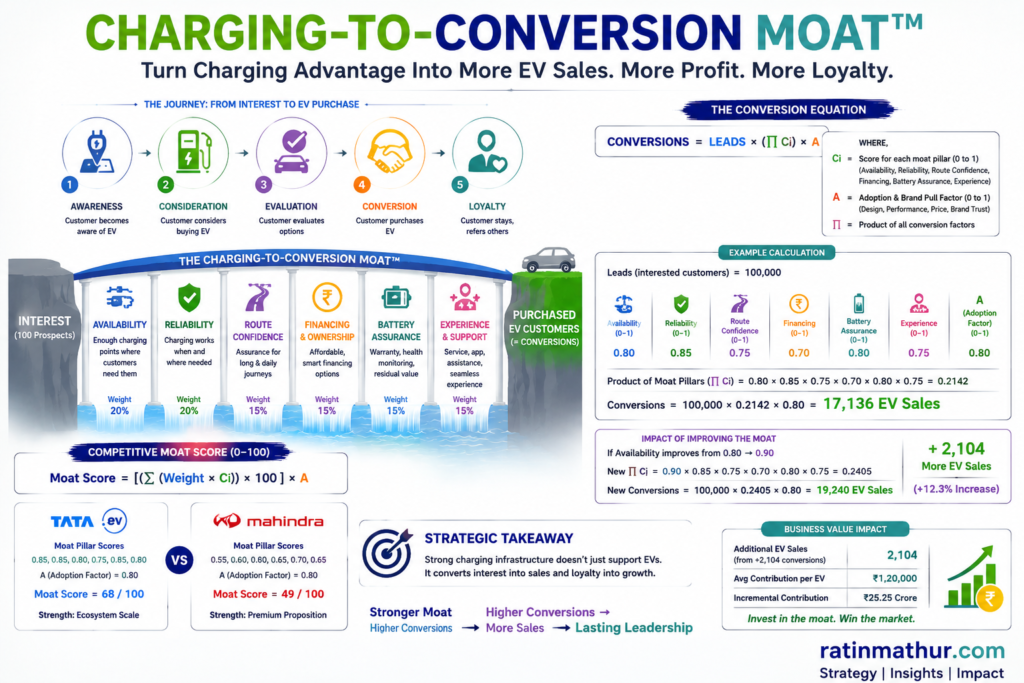
The Charging-to-Conversion Moat™ addresses perhaps the most underestimated competitive variable in EVs: infrastructure is not merely a service capability; it can become a sales-conversion mechanism. The framework connects charging availability, reliability, financing, battery assurance, route confidence and customer experience to the probability that an interested consumer actually purchases an EV.
Tata has already built a substantial foundation. Its FY26 ecosystem included more than 200 Mega Charging Hubs, more than 2,500 verified chargers, access to more than 30,000 chargers and more than 200,000 home chargers. Mahindra therefore should not attempt to win a national charging-infrastructure race purely by replicating Tata’s footprint. Its more strategic option is to build high-reliability charging around the routes, cities and customer segments where its premium electric SUVs are concentrated.
| Charging-to-Conversion Moat™ | Strategic lever | Tata opportunity | Mahindra opportunity |
|---|---|---|---|
| Availability | More usable charging points | Extend network density | Concentrate on high-value SUV corridors |
| Reliability | Higher successful charging rate | Strengthen trust advantage | Differentiate on premium experience |
| Route confidence | Predictable long-distance journeys | Use ecosystem scale | Build premium intercity corridors |
| Financing | Reduce upfront affordability barrier | Expand BaaS-style solutions | Bundle financing with premium ownership |
| Battery assurance | Reduce residual-value anxiety | Leverage lifetime warranty | Build long-term battery confidence |
| Customer data | Convert usage into better experience | Monetise large installed base | Rapidly build data from new EV customers |
The example is Tata’s use of BaaS and lifetime battery warranty to address affordability and battery anxiety, alongside its charging ecosystem. Mahindra can create a differentiated version by integrating premium charging access, battery health visibility, roadside assistance and financing into the E-SUV ownership proposition. The objective is to make the EV purchase decision feel less like acquiring a vehicle and more like acquiring a predictable mobility service. When infrastructure becomes part of the product proposition, competitors must replicate the entire ownership experience rather than simply match vehicle specifications.
Future Outlook & Conclusion
The next phase of India’s EV market will be fundamentally different from the first. The early phase rewarded first movers that could create awareness, establish trust and offer an acceptable product. The next phase will reward companies that can simultaneously deliver technology, affordability, reliability, scale and returns.
Tata enters this phase with the stronger starting position. Its 89,393 domestic EV sales in FY26, 40.2% market share, 250,000-plus installed base and extensive charging ecosystem create a significant competitive moat. Its broad product portfolio also gives it multiple opportunities to capture incremental EV demand as adoption moves beyond early adopters.
Mahindra enters with a different advantage. Its 57,472 electric four-wheelers in FY26 represented 305.2% growth, while its E-SUV business generated 9.1% EBITDA and 2.0% EBIT margins in its first full year. Its EV penetration reached 12% in Q1 FY27, above the industry’s 9%, while EV-SUV volumes grew 77%. These indicators suggest that Mahindra is not simply participating in electrification; it is building an electric-SUV franchise around one of the strongest structural trends in Indian passenger vehicles.
The most likely near-term outcome is therefore that Tata remains the EV volume leader while Mahindra becomes the most credible premium electric-SUV challenger. The more consequential possibility is that Mahindra eventually closes much of the volume gap while preserving superior economics. If that happens, the industry could move from a Tata-led EV market toward a two-pole competitive structure.
The decisive strategic metric should consequently not be market share alone. It should be the combination of EV penetration, volume growth and EV profitability. A company that grows rapidly but destroys margins has not necessarily built the future. A company that protects margins but cannot scale has not built the future either. The winner will be the manufacturer that creates a self-reinforcing relationship between customer adoption, product desirability, ecosystem confidence, manufacturing scale and economic returns.
The deeper lesson is that India’s EV race is evolving from a technology race into a business-model race. Tata’s opportunity is to transform its first-mover scale into an enduring ecosystem moat. Mahindra’s opportunity is to transform its electric-SUV differentiation into a scalable, profitable platform. The company that executes that transformation most effectively will not merely sell more electric cars. It will shape the economics and consumer expectations of India’s electric mobility market.
References
- Mahindra & Mahindra Limited. (2026). Integrated annual report 2025–26. Mahindra & Mahindra FY26 Annual Report
- Tata Motors Passenger Vehicles Limited. (2026). 81st integrated annual report 2025–26. Tata Motors Passenger Vehicles Annual Report 2025–26
- Mahindra & Mahindra Limited. (2026, July 30). M&M results Q1 F27. Mahindra Q1 FY27 results
- Tata Motors Passenger Vehicles Limited. (2026, August 13). Q1 FY27 earnings call transcript.
- Tata Passenger Electric Mobility Limited. (2026). TATA.ev: Explore Tata Motors range of electric vehicles. TATA.ev official website
- Tata Passenger Electric Mobility Limited. (2026, June 20). TATA.ev accelerates mainstream EV adoption with the new Punch.ev. TATA.ev Punch.ev announcement
- Mahindra & Mahindra Limited. (2026). Investor relations: Quarterly results, reports and presentations. Mahindra Investor Relations
Disclaimer
This article is an independent strategic analysis prepared for educational, professional and informational purposes. The analysis is based principally on company disclosures, annual reports, management commentary and official company information available as of August 2026. Company-reported metrics may use different definitions, methodologies and reporting boundaries; consequently, measures such as market share, revenue share and EV profitability should not be treated as perfectly comparable unless explicitly stated. Future scenarios, strategic interpretations and framework applications are analytical judgments rather than company guidance or forecasts. The article does not constitute investment, financial, legal, tax or accounting advice, nor does it constitute a recommendation to buy, sell or hold securities of Tata Motors, Mahindra & Mahindra or any related entity. Readers should conduct their own due diligence and consult qualified professional advisers before making investment or business decisions.