An Analytical Research Paper on Income Inequality, Wealth Concentration, Household Consumption, Employment, and Inclusive Economic Growth
Executive Summary
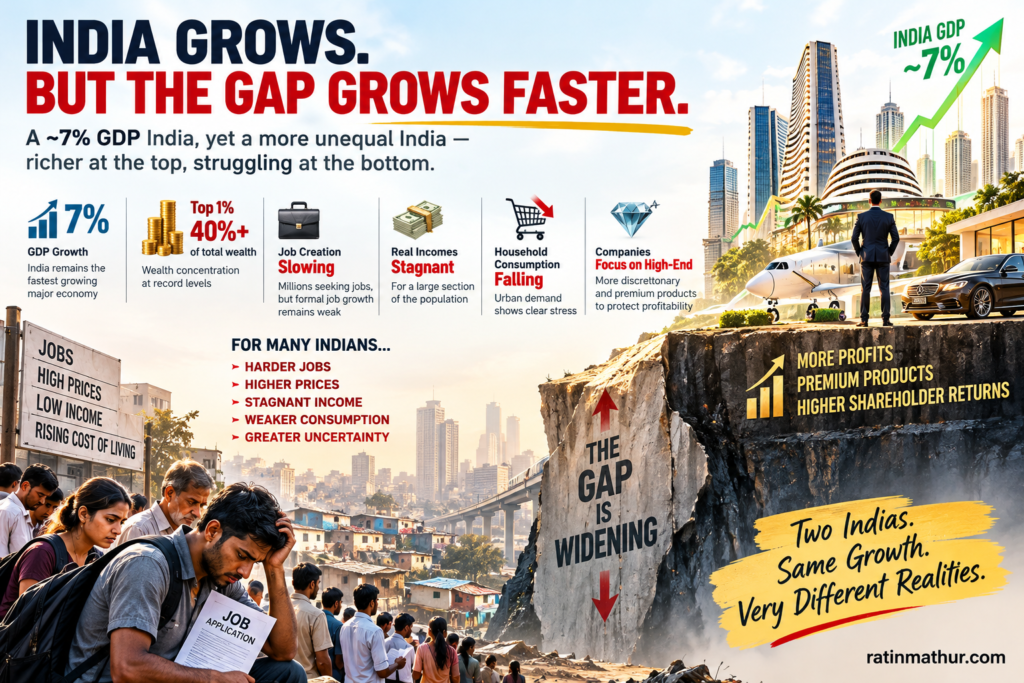
India is growing rapidly, but the distribution of its economic gains deserves closer examination. Real GDP growth is estimated at 7.4% for FY2025-26, and the economy expanded by 7.8% in the first quarter of FY2026-27. Yet strong aggregate growth does not necessarily imply that household incomes, purchasing power, employment security, and wealth are improving at the same pace across the population (Ministry of Finance, 2026; Ministry of Statistics and Programme Implementation [MoSPI], 2026a).
The World Inequality Report 2026 estimates that India’s richest 10% receive 57.7% of national income and own 65% of total wealth. The bottom 50% receive approximately 15% of income and hold only 6.4% of wealth. The top 1% alone own approximately 40.1% of wealth (World Inequality Lab, 2026). These figures reveal a substantial disparity in economic resources and the capacity to benefit from asset appreciation, investment returns, and intergenerational wealth transfers.
Labor market evidence adds another dimension. Research published by the Institute for Competitiveness in 2025 found that, between 2017-18 and 2023-24, the nominal income threshold for the bottom 10% of workers increased at a compound annual growth rate of 3.55%, compared with 6.99% for the top 1%. Over the same period, the top 1% income threshold relative to the bottom 50% threshold increased from 5.89 times to 6.25 times (Kapoor & Anand, 2025). This suggests that labor income gains have been uneven, although nominal figures must be adjusted for inflation before determining the change in real purchasing power.
Consumer markets provide visible evidence of this divergence. Between 2019 and 2025, India’s passenger vehicle market expanded by 54.2%, but sales of vehicles priced below ₹10 lakh remained virtually unchanged in absolute terms. Their share of the new passenger vehicle market consequently declined from 80.4% to 51.9%, while sales of higher-priced vehicles increased substantially (Das, 2026). SUVs have also gained market share. In real estate, homes priced at ₹1 crore and above accounted for approximately 78% of residential sales value across 50 major cities in 2025 (CREDAI & Liases Foras, 2026).
These developments do not prove that every premium buyer is wealthy or that every lower-income household is becoming poorer. Product preferences, inflation, financing conditions, regulatory requirements, and the changing composition of supply also affect market outcomes. However, the combination of concentrated wealth and weaker expansion in certain lower-priced consumer segments raises legitimate questions about affordability and the distribution of purchasing power.
The consumption picture is similarly nuanced. India’s private final consumption expenditure grew by 7.1% in real terms in Q1 FY2026-27, and the government estimates that its share of GDP reached 61.5% in FY2025-26, the highest since FY2011-12 (Ministry of Finance, 2026; MoSPI, 2026a). Therefore, the evidence does not support a blanket claim that total household consumption is falling. The more important concern is whether growth in consumption is broad-based, whether essential expenditure is absorbing an excessive share of household budgets, and whether lower-income households can save and acquire assets.
The central argument of this paper is that India’s challenge is not a lack of economic growth but the unequal conversion of growth into economic security. The country needs to measure success through productivity and GDP alongside real wages, income distribution, employment quality, household financial resilience, affordable housing, and access to mobility. Four original strategic frameworks are proposed to help governments, businesses, and institutions address this challenge.
Introduction
Economic growth is one of the principal foundations of national development. It expands productive capacity, creates opportunities for entrepreneurship, finances infrastructure, and can improve living standards. However, GDP growth alone cannot establish whether an economy is becoming more equal or whether its citizens are sharing in the benefits of expansion.
India presents a compelling case for examining this distinction. The country combines rapid economic growth with highly concentrated wealth, substantial informal employment, considerable regional disparities, and differences in the ability of households to afford major purchases.
The contrast is increasingly visible in consumer markets. Expensive apartments are finding buyers, SUVs are taking a larger share of the automobile market, and companies are developing more premium offerings. At the same time, entry-level vehicles have lost market share, affordable housing faces supply constraints in important cities, and many households remain dependent on employment income to meet essential expenses.
Businesses are not necessarily acting irrationally when they prioritize premium products. Higher-priced products may offer better margins, greater revenue per customer, or stronger demand from targeted segments. As a result, companies have commercial incentives to allocate capital toward these markets. The wider economic question is whether the consumption pattern emerging from these incentives reflects a corresponding improvement in the financial position of the population as a whole.
Income inequality and wealth inequality must also be distinguished. Income determines the flow of economic resources over a period, while wealth represents accumulated assets after accounting for liabilities. A household that earns a modest salary but owns no property or financial investments has a different financial position from a household receiving income from property, business ownership, and investments. Wealth can generate further income, provide access to credit, and offer protection against economic shocks.
Consequently, a country can experience rising production, growing premium consumption, and improving average income while economic opportunities remain disproportionately concentrated among households that already own assets.
The central question is therefore not whether India is growing. It is whether the benefits of that growth are reaching the broader population through higher real earnings, secure employment, affordable necessities, and opportunities to build wealth.
Problem Statement & Objectives
The principal problem examined in this paper is the possibility that India’s economic growth and premium consumer markets are expanding faster than the financial security of lower- and middle-income households.
This problem has several interconnected dimensions. Income and wealth concentration influence which households benefit from rising asset values. Uneven wage growth affects the ability of workers to maintain purchasing power and build savings. Inflation can absorb income gains, particularly when food and other essential expenses rise rapidly. Premiumisation in housing and automobiles can make major purchases increasingly difficult for households that depend primarily on labor income.
Employment insecurity introduces an additional risk. A worker who loses a job may face immediate financial pressure, while a household with substantial assets can often withstand a temporary loss of income. Artificial intelligence may also change recruitment patterns and the demand for routine tasks, requiring workers to adapt to changing skill requirements.
The objective is to evaluate these forces through measurable economic indicators, distinguish evidence of inequality from assumptions about universal impoverishment, and identify practical interventions that could improve the distribution of economic opportunities.
The paper also seeks to establish a more comprehensive approach to measuring economic progress. In addition to GDP growth and aggregate consumption, India should assess income shares, wealth ownership, real wage growth, employment security, youth employment, household savings, essential expenditure, and the affordability of major consumer purchases. Taken together, these indicators provide a more useful assessment of whether economic expansion is generating broad-based prosperity.
Methodology
This paper uses secondary research based on official economic statistics, international inequality estimates, labor market research, automobile industry data, real estate reports, and consumer market analysis. Principal sources include the World Inequality Lab, MoSPI, the Ministry of Finance, the World Bank, the Institute for Competitiveness, CREDAI-Liases Foras, Knight Frank India, and the Indian Council for Research on International Economic Relations.
The analysis distinguishes income inequality, wealth inequality, consumption inequality, employment conditions, and consumer market premiumisation. These measures represent different aspects of economic well-being and should not be used interchangeably.
Automobile market share is examined alongside absolute vehicle sales and inflation-adjusted price thresholds. Housing evidence distinguishes sales value from the number of homes sold. Employment data distinguish unemployment from job quality and wage adequacy. Consumption data distinguish aggregate private final consumption expenditure from the spending patterns of households at different income levels.
The findings are interpreted with appropriate limitations. In particular, a growing premium product category is not by itself proof of increasing inequality. Likewise, improvements in average income or consumption do not establish that economic gains are evenly distributed. The four strategic frameworks introduced later are original conceptual models developed for this paper. They are intended to guide policy and business decision-making rather than represent empirically validated statistical models.
Landscape Analysis
GDP Growth And The Distribution Of National Income
India’s economic performance provides the starting point for the analysis. Real GDP growth was estimated at 7.4% for FY2025-26, while real GDP expanded by 7.8% in Q1 FY2026-27 (Ministry of Finance, 2026; MoSPI, 2026a). These are strong aggregate growth figures, but they do not reveal how the additional output is distributed among households.
The World Inequality Report 2026 estimates that the richest 10% receive 57.7% of national income, while the bottom 50% receive 15%. The disparity is even more pronounced in wealth ownership, with the richest 10% holding 65% of total wealth and the top 1% holding 40.1% (World Inequality Lab, 2026).
The report’s country estimates indicate that inequality remains structurally high. However, its estimated ratio of average income between the top 10% and the bottom 50% changed only marginally, from 38.0 times in 2014 to 38.2 times in 2024. This distinction matters: the strongest evidence is that India has an exceptionally concentrated distribution of income and wealth, while not every inequality indicator has increased continuously in the most recent period.
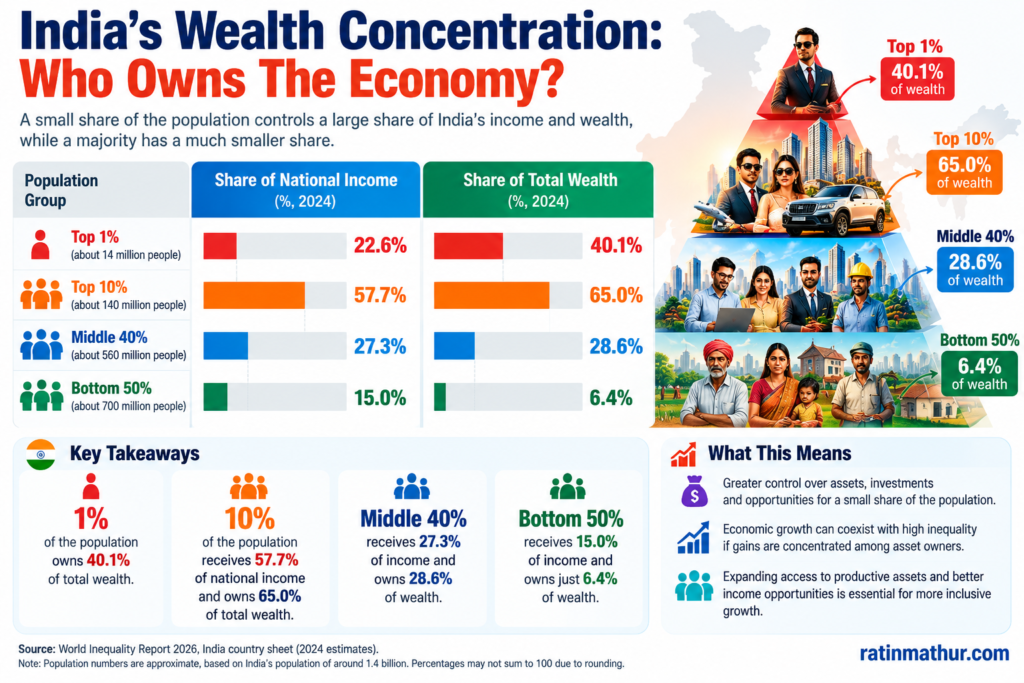
A high growth rate can therefore coexist with concentrated gains. If wealth owners benefit disproportionately from asset appreciation and investment returns, their financial position may improve faster than that of households relying mainly on wages. This does not mean every wealthy household gains or every low-income household loses. It means that the structure of asset ownership affects the capacity to benefit from growth.
Income Growth And The Wage Gap
Labor income provides a more direct view of how economic growth reaches workers. The Institute for Competitiveness’ analysis of Periodic Labour Force Survey data estimated that median annual worker income increased from ₹1.02 lakh in 2017-18 to ₹1.44 lakh in 2023-24, representing a nominal compound annual growth rate of approximately 5.92% (Kapoor & Anand, 2025).
However, income gains were not evenly distributed across income thresholds. The estimated nominal income threshold for the bottom 10% grew at 3.55% annually, compared with 6.99% for the top 1%. The ratio between the top 1% income threshold and the bottom 50% threshold increased from 5.89 to 6.25 over the same period (Kapoor & Anand, 2025).
These figures require two qualifications. First, the study examines income thresholds rather than the average income of every household within each group. Second, the reported rates are nominal. Exact changes in real purchasing power require adjustment for cumulative inflation over the corresponding period.
Nevertheless, the evidence indicates that headline income growth can obscure different experiences across the earnings distribution. A worker whose earnings increase slowly may struggle to save after rent, food, transport, and healthcare expenses, while a higher-income household retains more capacity to invest.
Employment, Job Quality, And Economic Security
Employment is another essential dimension of inequality. The official PLFS annual report for 2025 recorded an unemployment rate of 3.1% among people aged 15 and above under its usual-status measure. Youth unemployment among people aged 15-29 stood at 9.9%, while 25% of this age group were not in employment, education, or training (MoSPI, 2026b).
These measures show why the unemployment rate alone cannot describe labor market conditions. A person may be employed but earn too little to accumulate savings. Another may be engaged in unstable self-employment or casual work without reliable income or social protection. A graduate may be working in a job that does not use their skills or provide a pathway to higher earnings.
Nominal earnings did improve in 2025. Average monthly earnings for male regular wage and salaried workers increased from ₹22,891 in 2024 to ₹24,217 in 2025, approximately 5.8%. For female regular wage and salaried workers, the increase was from ₹17,126 to ₹18,353, approximately 7.2% (MoSPI, 2026b). These figures do not imply that incomes are universally stagnant. However, the interaction between wages, inflation, household expenditure, and differences across occupations determines whether workers experience meaningful improvements in living standards.
AI adds another source of uncertainty. An ICRIER study of 651 Indian IT firms found no evidence of large-scale job losses following AI adoption in the firms surveyed, but it identified moderation in hiring, particularly for entry-level positions (Mishra et al., 2026). The distinction between widespread job losses and slower recruitment is important. Both can affect economic mobility, but they require different responses.
Household Consumption: Growth In Aggregate, Unevenness Across Markets
The claim that household consumption is falling nationally requires qualification. The official national accounts show that real private final consumption expenditure grew by 7.1% year over year in Q1 FY2026-27, up from 6.8% in the corresponding quarter of the previous year. Its estimated share of GDP reached 61.5% in FY2025-26 (Ministry of Finance, 2026; MoSPI, 2026a).
These figures indicate that aggregate consumption is expanding, rather than collapsing. However, aggregate expenditure does not establish that every income group is experiencing the same improvement in purchasing power.
MoSPI’s Household Consumption Expenditure Survey estimated average monthly per-capita consumption expenditure in 2023-24 at ₹4,122 in rural India and ₹6,996 in urban India, excluding the imputed value of items received free through government welfare programs. Food accounted for 47.04% of rural household consumption expenditure and 39.68% of urban expenditure (MoSPI, 2025).
These averages conceal differences among households and regions. A household that spends a large proportion of its budget on necessities has less flexibility to purchase a vehicle, travel, upgrade its home, or invest. A higher-income household can continue purchasing premium goods even if its essential expenditure increases.
Official consumption Gini coefficients also declined between 2022-23 and 2023-24, reaching 0.237 in rural India and 0.284 in urban India (MoSPI, 2025). This is important counterevidence against the claim that every aspect of consumption inequality is worsening.
The more defensible conclusion is that aggregate consumption growth and improving measured consumption inequality can coexist with substantial wealth concentration and pressure in selected mass-market segments.
Automobiles: SUVs Gain Share While Entry-Level Cars Lose Ground
The automobile market provides an important illustration of market premiumisation. JATO Dynamics data reported by Business Standard shows that India’s passenger vehicle market expanded from 2.97 million units in 2019 to 4.58 million units in 2025, an increase of 54.2%. Over the same period, sales of vehicles priced below ₹10 lakh remained nearly unchanged, at approximately 2.38 million units in 2025 compared with 2.39 million in 2019. Consequently, the segment’s share of the market fell from 80.4% to 51.9% (Das, 2026).
Sales of vehicles priced above ₹10 lakh increased from approximately 583,000 units to 2.2 million over the period. The trend indicates that much of the incremental market growth occurred outside the traditional sub-₹10-lakh price band.
| Automobile Market Indicator | 2019 | 2025 | Interpretation |
|---|---|---|---|
| Total passenger vehicle sales | 2.97 million | 4.58 million | The market expanded significantly. |
| Sales below ₹10 lakh | 2.39 million | 2.38 million | Sales were nearly flat at the fixed nominal threshold. |
| Market share below ₹10 lakh | 80.4% | 51.9% | The nominal price-band share declined substantially. |
| Sales above ₹10 lakh | Approximately 0.58 million | Approximately 2.2 million | Higher-priced vehicles captured much of the expansion. |
Source: JATO Dynamics data reported by Das (2026), Business Standard.
A critical qualification is necessary. A fixed ₹10-lakh threshold does not account for inflation. JATO estimates that ₹10 lakh in 2019 was equivalent to approximately ₹13.58 lakh in 2025. Using this inflation-adjusted threshold, vehicle sales increased from 2.39 million to approximately 3.37 million, and market share declined from 80.4% to 73.4% (Das, 2026). Thus, the apparent decline is smaller after adjusting for inflation, but the inflation-adjusted segment still grew more slowly than the overall market.
SUVs have also gained share. In FY2026, they accounted for approximately 56.7% of domestic passenger vehicle sales, while hatchbacks represented approximately 21%, according to industry figures reported by Moneycontrol (Moneycontrol, 2026).
This does not establish that every SUV buyer is wealthy or that all small-car buyers are poor. Buyers choose SUVs for multiple reasons, including ground clearance, vehicle design, family needs, perceived safety, and product availability. Rising manufacturing costs, stricter regulations, and higher feature content have also affected vehicle prices.
However, the shift reveals a potential affordability problem. If first-time buyers find that the lowest-priced new vehicles become less available or less affordable while higher-value products account for most incremental market growth, their ability to transition from two-wheelers to four-wheelers may be constrained.
The used-car market reinforces this concern. JATO data cited by Business Standard indicates that approximately 90% of used cars sold in FY2024-25 were priced at ₹10 lakh or below (Das, 2026). This points to the continued importance of affordable price points for a much broader segment of buyers than the new premium-car market alone would suggest.
Housing: Sales Value Concentrates In Higher-Priced Homes
Residential property provides another example. CREDAI-Liases Foras reported approximately ₹8.46 lakh crore in residential sales value across 50 major Indian cities in 2025. Homes priced at ₹1 crore and above accounted for 78% of total sales value (CREDAI & Liases Foras, 2026).
This figure reflects the value of transactions, not the proportion of households able to afford such properties. A relatively small number of expensive homes can account for a large share of total sales value.
Knight Frank India’s report on eight major residential markets similarly found that sales of homes priced above ₹1 crore increased in 2025, whereas sales below ₹50 lakh declined by 17% (Knight Frank India, 2026). This divergence suggests that premium housing demand was comparatively stronger than demand in lower-priced categories in those markets.
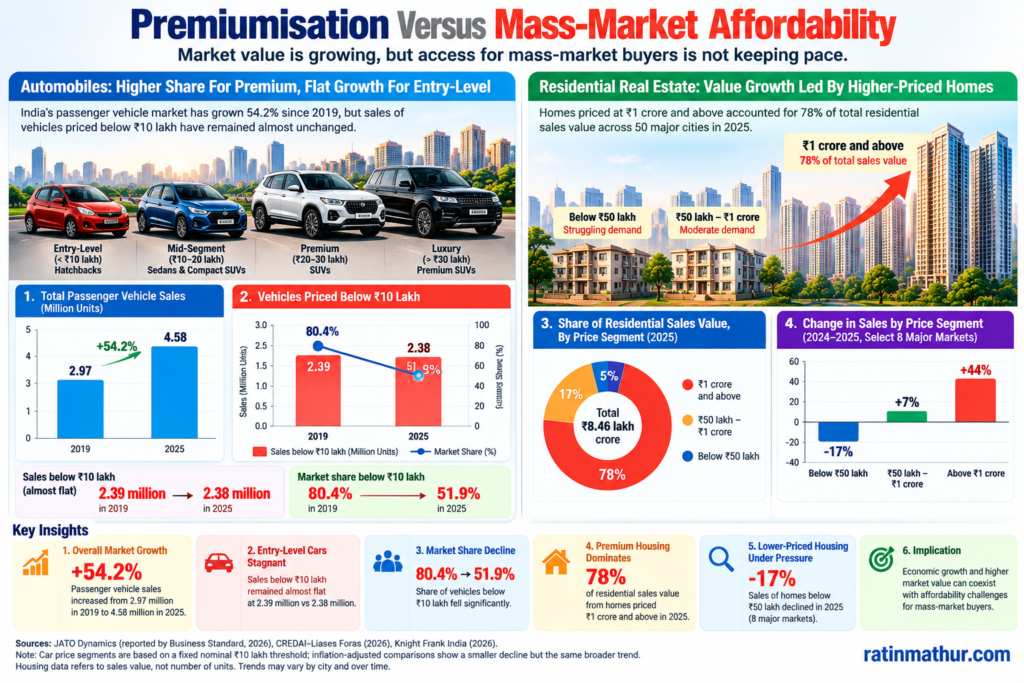
The distributional issue is that property owners can benefit from appreciation and rental income, while households without property may face increasing purchase costs. Rising property values do not automatically make every owner wealthier in a usable sense, particularly where mortgages remain outstanding. However, existing assets generally provide financing options and financial buffers that non-owners do not possess to the same extent.
Inflation, Savings, And Household Financial Resilience
Inflation affects inequality through the composition of household expenditure. India’s retail inflation reached 5.54% in September 2026, while food inflation reached 7.74%. Rural retail inflation stood at 6.08%, compared with 4.88% in urban areas (MoSPI, 2026c).
When food and other essential expenses rise, households with limited discretionary income have less room to absorb higher costs without reducing savings or postponing purchases. Higher-income households generally have greater flexibility, although the actual effects depend on their spending patterns and financial obligations.
The appropriate question is not merely whether nominal income is rising, but whether it rises sufficiently to cover essential expenditure while leaving resources for saving and investment. A household with little residual income cannot easily build an emergency fund, finance education, acquire financial assets, or accumulate a deposit for a home.
At the same time, national saving data should not be ignored. Official figures indicate that total household savings increased from approximately ₹52.25 lakh crore in 2022-23 to ₹69.01 lakh crore in 2024-25, while household liabilities declined from about ₹15.96 lakh crore to ₹15.71 lakh crore over that period (Ministry of Finance, 2026b). These aggregate figures do not support a universal claim that household finances are deteriorating. They also do not reveal how savings and liabilities are distributed between affluent households and households with limited financial resources.
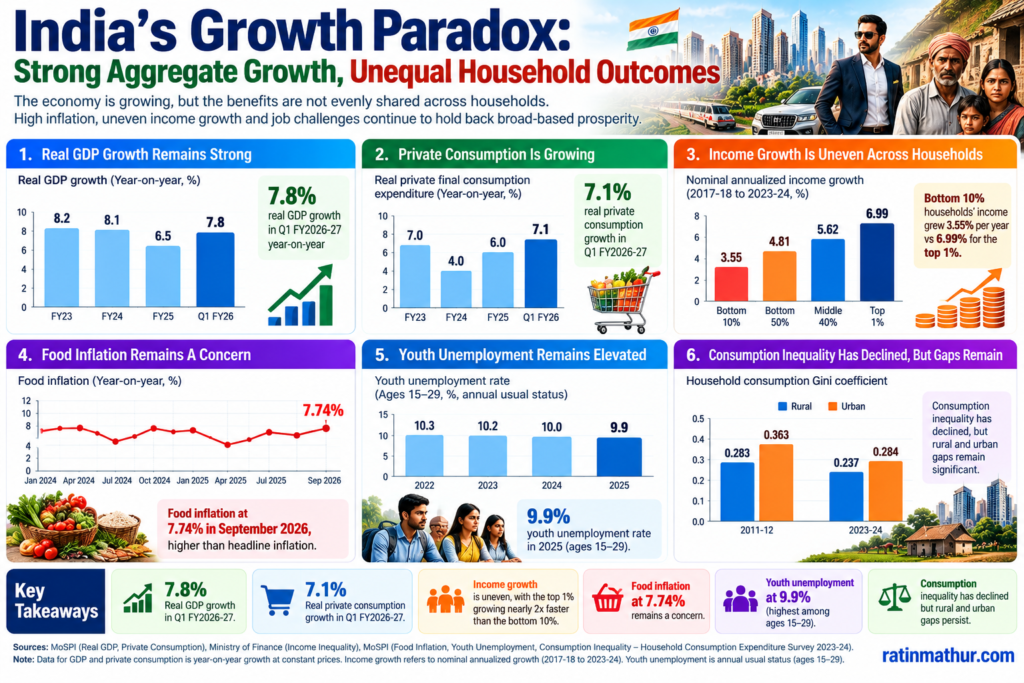
The central issue remains the distribution of financial resilience. Aggregate savings can rise even while a significant number of households lack adequate emergency funds.
Key Findings
The first finding is that India’s economic growth is strong, but wealth remains highly concentrated. The richest 10% own approximately 65% of national wealth, while the bottom 50% hold just 6.4% (World Inequality Lab, 2026). This difference shapes access to returns on assets, financing, and protection against economic shocks.
The second finding is that labor income growth is uneven. Evidence from 2017-18 to 2023-24 indicates that the nominal income threshold for the bottom 10% grew more slowly than that of the top 1%. This is consistent with a distributional challenge, although exact changes in real incomes require inflation adjustment (Kapoor & Anand, 2025).
The third finding is that household consumption is not falling uniformly across India. Aggregate real private consumption continues to grow, and official survey data indicate improvements in measured consumption inequality. Nevertheless, aggregate growth cannot establish that all households have adequate purchasing power, savings, or access to major consumer goods.
The fourth finding is that consumer markets are becoming more premium-oriented in important categories. Higher-priced cars have captured a disproportionate share of incremental automobile sales, while premium residential properties account for a substantial share of housing market value. These patterns are evidence of changing market composition, but they are not direct measures of income inequality.
The fifth finding is that employment and inflation interact with asset inequality. Workers who depend primarily on wages have less protection from job disruption and essential-cost increases than households with substantial assets. AI may increase productivity, but changes in entry-level hiring and skill requirements can influence the distribution of future opportunities.
The sixth finding is that India needs better measures of economic inclusion. Income distribution, wealth ownership, real wage growth, household savings by income group, affordable housing, vehicle affordability, and career access should be evaluated alongside GDP growth.
Challenges & Opportunities
The central challenge is to convert economic growth into wider economic security without weakening the incentives that support entrepreneurship, investment, and innovation. Businesses will continue to respond to customer demand and profitability. Premium products can generate investment, jobs, and economic value. The policy concern is whether economic opportunities and purchasing power are developing sufficiently across the wider population.
A related challenge is the ability of workers to convert employment into savings. When earnings leave little money after essential expenses, households may find it difficult to finance education, purchase suitable housing, or acquire productive assets. This limits their capacity to benefit from economic growth and can increase their exposure to future disruption.
Affordable consumer goods also matter. Entry-level cars, reasonably priced homes, and essential consumer products can expand access to mobility, housing, and improved living standards. Their commercial viability depends on costs, consumer demand, supply chains, and policy. The opportunity is to make the production and supply of affordable products sustainable rather than relying entirely on subsidies or price controls.
AI creates both opportunities and risks. Productivity gains can support higher output and new services, but workers may require practical training and alternative career pathways. Businesses can improve competitiveness while investing in skills, job redesign, and professional development.
The broader opportunity is to design economic policies and corporate strategies that connect investment with productivity, employment quality, household purchasing power, and asset accumulation. This requires stronger data, targeted interventions, and measurable accountability.
Strategic Frameworks & Recommendations
1. Prosperity Transmission Framework™: Connecting GDP Growth With Household Prosperity
The Prosperity Transmission Framework™ proposes that economic growth should be evaluated through the channels by which it reaches households. Investment creates productive capacity, productivity supports economic output, and output can generate employment and earnings. Those earnings must then translate into real disposable income and the ability to save, invest, and withstand shocks.
The framework addresses the gap between macroeconomic growth and household financial security. A company may report higher output and profits without proportionate wage growth. A region may attract substantial investment without creating enough productive employment for local workers. A growing consumer market may still leave many households unable to afford its products.
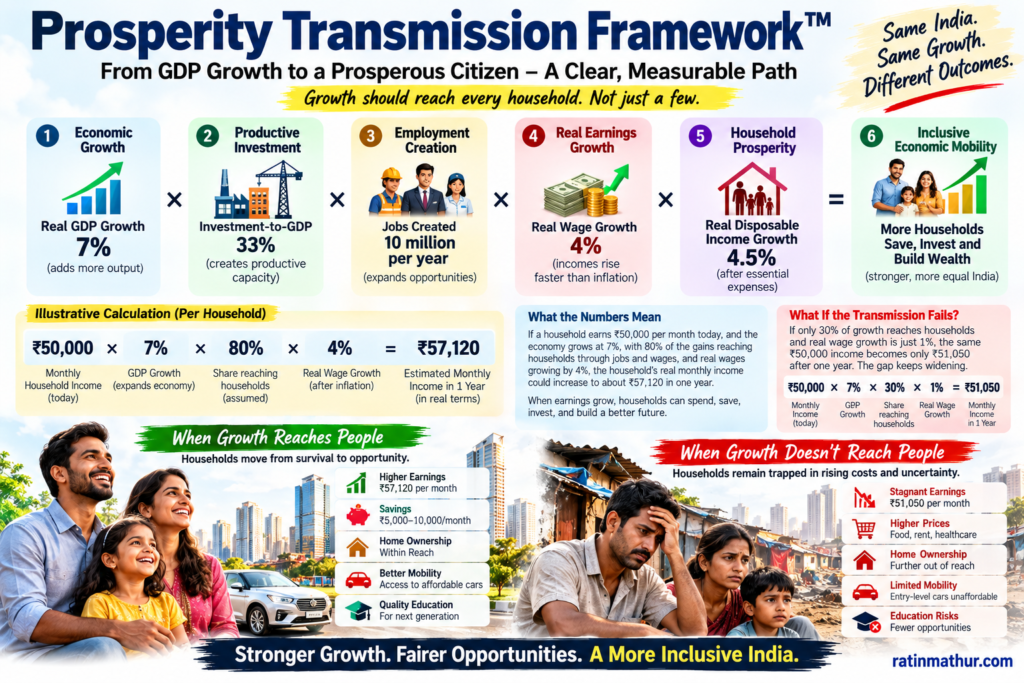
Consider a manufacturer investing in automation. Traditional analysis may focus on lower production costs, higher utilization, and improved returns. The Prosperity Transmission Framework™ also asks whether the investment supports employee reskilling, higher-skilled jobs, supplier development, and more affordable products. The framework does not assume that all investment must maximize employment, but it requires decision-makers to assess how productivity improvements affect workers and consumers.
| Transmission Stage | Core Question | Indicator | Example |
|---|---|---|---|
| Economic Growth | Is national output expanding? | Real GDP and sectoral output growth | Manufacturing investment increases industrial capacity. |
| Productive Investment | Is capital generating sustainable productivity? | Output per worker and return on investment | A factory reduces defects and improves throughput. |
| Employment And Earnings | Are workers gaining opportunities and income? | Job creation, real wage growth, and employment stability | Employees receive technical training and move into higher-skilled roles. |
| Household Prosperity | Can households meet expenses and save? | Real disposable income and savings capacity | Workers retain more income after essential expenditure. |
| Economic Mobility | Can households acquire assets and withstand shocks? | Financial resilience and access to productive assets | Families build savings and invest in education or suitable assets. |
Governments can use the framework to assess whether industrial incentives generate sustainable employment and local economic participation. Corporate boards can require investment proposals to disclose expected productivity gains alongside workforce effects. Employers can measure whether operating improvements translate into improved employee capability and career progression.
The recommended practice is to pair conventional financial and productivity indicators with a small set of household-oriented measures. This will help distinguish investment that expands output alone from investment that also widens access to economic opportunity.
2. Inclusive Asset Ownership Ladder™: Expanding Access To Wealth Creation
The Inclusive Asset Ownership Ladder™ focuses on the transition from earning income to building and retaining wealth. A household cannot accumulate assets consistently if essential expenses consume nearly all its earnings. Even when saving becomes possible, limited financial access, high borrowing costs, insecure employment, and inadequate financial knowledge may constrain progress.
The framework describes a sequence that begins with stable income and protection against financial shocks, then moves toward emergency savings, appropriate financial assets, and productive investments. The stages are not rigid or universal. Renting can be preferable to buying a home in some circumstances, and not every household should take on investment risk. The objective is to broaden access to suitable wealth-building opportunities.
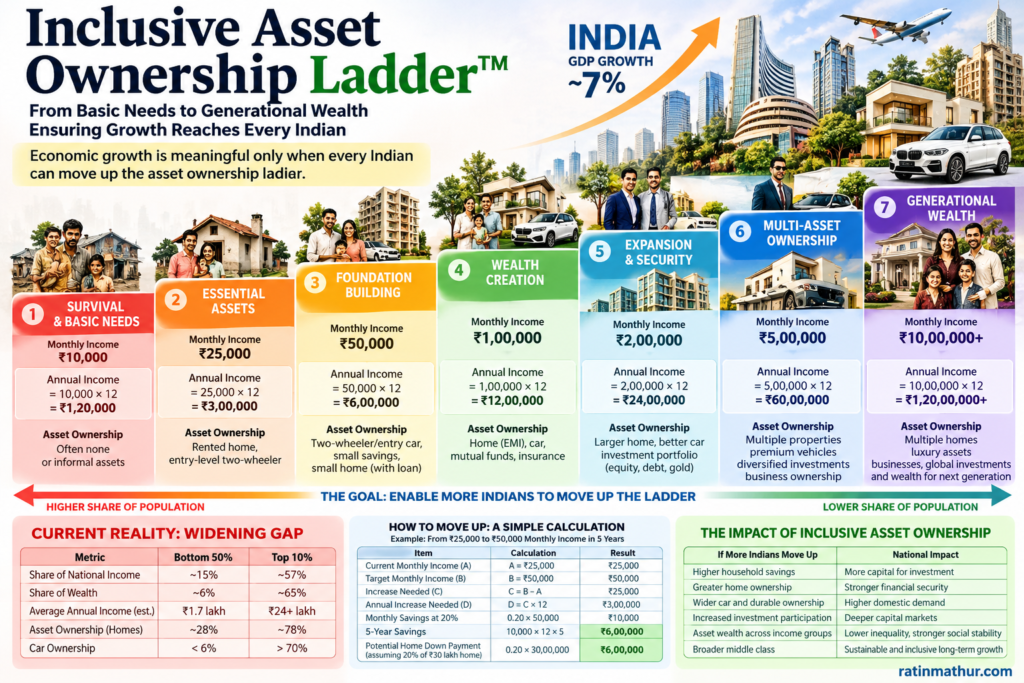
For example, a young salaried employee may be able to cover monthly expenses but have insufficient savings to manage an unexpected medical bill or a period of unemployment. Access to appropriate insurance, automatic savings mechanisms, affordable financial products, and transparent financial education could improve resilience. Higher earnings could subsequently support investment or additional training that improves future earning capacity.
| Stage | Objective | Intervention | Example Of Progress |
|---|---|---|---|
| Income Stability | Secure dependable earnings | Employability support and formal employment pathways | A worker obtains stable paid employment. |
| Financial Protection | Reduce vulnerability to shocks | Appropriate insurance and accessible social protection | An emergency does not require high-cost borrowing. |
| Savings Capacity | Build a financial buffer | Automatic saving and suitable low-cost accounts | The household accumulates emergency funds. |
| Productive Asset Access | Increase long-term wealth-building options | Transparent investment access and responsible credit | The household begins diversified investing. |
| Wealth Preservation | Sustain financial security | Retirement planning and career development | Savings support education, retirement, or a viable business. |
Implementation requires cooperation among financial institutions, employers, governments, and educational institutions. Employers can improve financial wellness programs and explain retirement benefits. Financial institutions can make suitable savings and investment products easier to understand. Governments can reduce barriers to formal participation and strengthen access to social protection.
Success should be assessed through household savings, emergency resilience, debt quality, and ownership of appropriate productive assets, rather than through the number of accounts opened or the amount of credit extended alone. The strategic objective is to improve the capacity of households to retain income and use it productively.
3. Housing Affordability and Market Alignment Framework™: Aligning Development With Household Purchasing Power
The Housing Affordability and Market Alignment Framework™ addresses the gap between property market growth and the ability of households to obtain suitable housing. Premium residential development can generate economic activity, but high sales values do not establish that housing is accessible to a broad population.
The framework evaluates local income levels, mortgage affordability, land and construction costs, infrastructure, employment locations, supply availability, and developer viability. It recognizes that affordability cannot be achieved through subsidies alone. Suitable housing must be financially viable to build, located within reasonable reach of employment, and priced within the repayment capacity of intended buyers.
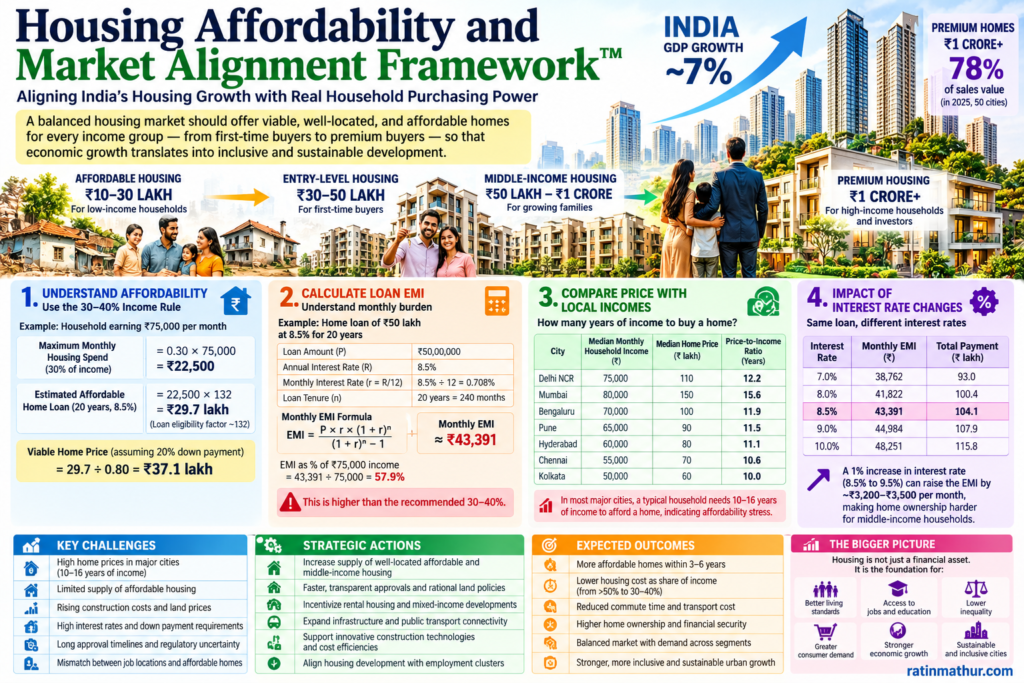
Consider a major employment cluster in Delhi-NCR. If residential investment primarily targets affluent buyers, workers earning modest wages may need to travel long distances or spend a large proportion of their income on accommodation. A housing strategy that combines appropriate density, transport connectivity, mixed-income developments, predictable approvals, and viable lower-priced projects could improve access to employment and reduce household living costs.
| Strategic Dimension | Recommended Intervention | Illustrative Application | Success Measure |
|---|---|---|---|
| Affordability Mapping | Match housing supply with household earnings | Assess viable price bands around industrial and service employment hubs | Supply by price segment relative to local incomes |
| Land And Infrastructure | Improve access to developable land and transport | Connect housing projects to jobs and reliable public transport | Commute times and infrastructure readiness |
| Project Viability | Reduce unnecessary approval delays | Make development rules predictable | Project costs and delivery timelines |
| Market Diversity | Support viable supply across price bands | Develop affordable, middle-income, and premium housing | Homes completed by price segment |
| Inventory Discipline | Assess demand before expansion | Monitor sales absorption and unsold homes | Inventory aging and sales velocity |
Public policy should encourage housing supply that is genuinely accessible to different income groups while preserving the financial viability of development. Developers should evaluate projects using realistic assumptions about local income, borrowing capacity, construction costs, and absorption.
The same principle can be applied to affordable mobility. Policymakers and automobile companies should examine whether the lowest-priced vehicles remain accessible and commercially viable. The objective is not to discourage SUVs or premium vehicles, but to ensure that consumers with different purchasing capacities retain practical options.
4. Human-AI Opportunity Dividend Framework™: Distributing The Benefits Of Technological Change
The Human-AI Opportunity Dividend Framework™ seeks to align AI adoption with productivity, workforce capability, and employment opportunity. AI can automate tasks and improve efficiency, but the total impact on employment depends on the nature of the work, the introduction of new services, business expansion, and the availability of alternative roles.
The framework encourages companies to evaluate AI investments across productivity, job redesign, workforce training, entry-level recruitment, and the creation of new value. The goal is not to prevent automation but to ensure that productivity improvements are accompanied by credible opportunities for workers to adapt.
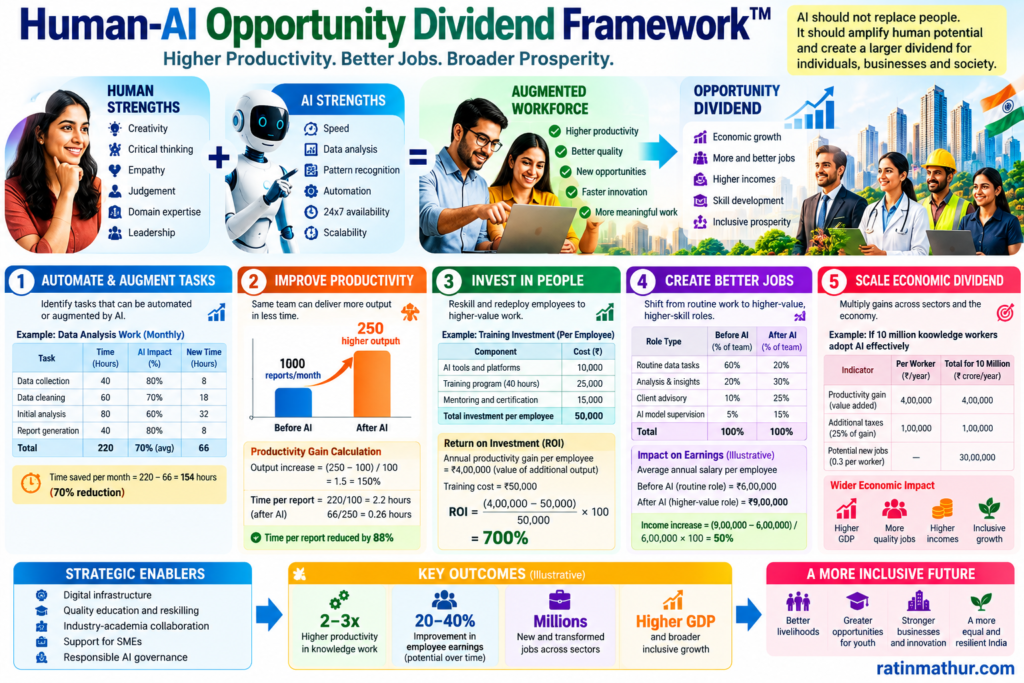
For example, an analytics department may use AI to automate routine data preparation and report generation. The company can reduce processing time while retraining analysts to validate results, interpret business performance, investigate exceptions, and advise managers. Supervised AI-assisted projects can provide junior employees with practical experience instead of removing the early-career tasks through which professional expertise develops.
| Strategic Pillar | Action | Illustrative Example | Success Measure |
|---|---|---|---|
| AI Opportunity Assessment | Identify tasks to automate or augment | Evaluate routine reporting before introducing AI | Productivity and accuracy |
| Workforce Transition | Provide practical reskilling | Train analysts to validate AI-generated outputs | Successful role transitions |
| Entry-Level Career Access | Preserve routes into skilled work | Create supervised AI-assisted apprenticeships | Entry-level hiring and progression |
| Productivity Dividend | Reinvest part of efficiency gains in capability | Expand training and develop new services | New roles and value creation |
| Accountability And Inclusion | Monitor the effects on workers | Review recruitment and employment outcomes | Job quality and workforce transition results |
Boards should require major AI investments to document expected productivity improvements, workforce implications, and transition plans. Employers should provide training connected to actual work, while educational institutions should collaborate with industry on practical skills.
Government policy should encourage responsible AI adoption, improve access to relevant training, and support workers facing significant transitions. Performance should be measured through productivity, job quality, retraining outcomes, wage progression, and the creation of new economic opportunities.
The framework’s central principle is that technological progress should be evaluated not only by its ability to reduce costs, but also by its contribution to sustainable productivity and the ability of workers to participate in the resulting economic value.
Future Outlook & Conclusion
India’s economic outlook should be assessed through two connected questions: how quickly is the economy expanding, and how widely are its gains reaching households?
The evidence demonstrates that strong GDP growth, expanding aggregate consumption, concentrated wealth, and uneven consumer market performance can coexist. India’s economy is not experiencing a uniform collapse in household spending. Real private consumption continues to expand, official consumption inequality measures have improved, and household savings have increased in aggregate. These are important positive indicators.
Nevertheless, wealth concentration remains high, income gains differ across the distribution, and lower-priced consumer categories have struggled to keep pace with overall market expansion. Entry-level car sales have remained almost flat at a fixed nominal price threshold while the broader automobile market has grown substantially. Premium homes account for a large share of residential sales value. These developments raise legitimate questions about whether the ability to purchase assets and discretionary goods is improving equally across the population.
The strongest conclusion is not that every poor household is becoming poorer. It is that India’s economic progress is taking place within a highly unequal distribution of assets and opportunities, creating different capacities to benefit from growth and withstand economic disruption.
The four frameworks proposed in this paper provide a connected approach. The Prosperity Transmission Framework™ links growth and investment to real earnings and household security. The Inclusive Asset Ownership Ladder™ focuses on the ability to save and build productive assets. The Housing Affordability and Market Alignment Framework™ aligns development decisions with household purchasing power. The Human-AI Opportunity Dividend Framework™ connects technological adoption with workforce capability and sustainable employment.
For policymakers, the priority is to improve real earnings, support productive employment, broaden access to assets, and strengthen the availability of affordable housing and mobility. For businesses, the challenge is to understand that premium sales growth does not necessarily indicate broad-based purchasing power. For financial institutions, the opportunity is to help households build resilience and participate in long-term wealth creation.
India’s next stage of development will be more inclusive if growth translates into better employment, stronger purchasing power, accessible housing, and the ability to accumulate wealth across a wider population. The objective is not to suppress prosperity at the top, but to expand the number of people who can participate in generating and retaining it.
The ultimate measure of economic success is not only how rapidly India grows or how expensive its most sought-after apartments and automobiles become. It is whether a larger share of the population can build secure livelihoods, afford essential goods and services, save consistently, acquire productive assets, and participate meaningfully in the nation’s progress.
References
- Bharti, N. K., Chancel, L., Piketty, T., & Somanchi, A. (2026). Income and wealth inequality in India, 1922-2023: The rise of the billionaire raj. The World Bank Economic Review. https://doi.org/10.1093/wber/lhag013
- Confederation of Real Estate Developers’ Associations of India, & Liases Foras. (2026). Indian real estate: CY 2025 report. https://credai.org/media/view-details/?file_no=103
- Das, S. (2026, October 8). In 2025, sub-₹10 lakh car market share fell to 52% from 80% in 2019. Business Standard. https://www.business-standard.com/amp/industry/auto/india-cars-below-rs-10-lakh-market-share-affordability-jato-126100800839_1.html
- Kapoor, A., & Anand, M. (2025, April 29). Income inequality and labour markets in India. Institute for Competitiveness. https://www.competitiveness.in/report-on-income-inequality-and-labour-markets-in-india/
- Knight Frank India. (2026). India real estate: Office and residential market, H2 2025. https://content.knightfrank.com/research/3070/documents/en/india-real-estate-office-and-residential-market-h2-2025-12597.pdf
- Mishra, D., Kedia, M., Reddy, A., Fernandez, C., & Khanduri, A. (2026). AI and jobs: This time is no different, a case study of India’s IT sector. Indian Council for Research on International Economic Relations. https://icrier.org/publications/ai-and-jobs-this-time-is-no-different-a-case-study-of-indias-it-sector/
- Ministry of Finance. (2026, January 29). India’s GDP growth for FY26 is estimated at 7.4 per cent. Government of India. https://www.pib.gov.in/PressReleasePage.aspx?PRID=2219912&lang=1®=3
- Ministry of Finance. (2026). Household savings and liabilities: Parliamentary response on economic stability. Government of India. https://sansad.in/getFile/annex/270/AU3584_wZyZvm.pdf?source=pqars
- Ministry of Statistics and Programme Implementation. (2025). Household consumption expenditure survey: Fact sheet, 2023-24. Government of India. https://www.mospi.gov.in/sites/default/files/publication_reports/HCES%20FactSheet%202023-24.pdf
- Ministry of Statistics and Programme Implementation. (2026a, August 31). Quarterly estimates of gross domestic product for the first quarter (April-June) of 2026-27. Government of India. https://www.pib.gov.in/PressReleaseIframePage.aspx?PRID=2304949&lang=2®=48
- Ministry of Statistics and Programme Implementation. (2026b, March 27). Periodic labour force survey annual report, 2025. Government of India. https://www.pib.gov.in/PressReleasePage.aspx?PRID=2246009&lang=1®=1
- Ministry of Statistics and Programme Implementation. (2026c, October 12). Consumer price index for September 2026. Government of India. https://www.pib.gov.in/PressReleasePage.aspx?PRID=2322244&lang=1®=3
- Moneycontrol. (2026). SUV dominance deepens in Indian car market as hatchback segment weakens. https://www.moneycontrol.com/automobile/suv-dominance-deepens-in-indian-car-market-as-hatchback-segment-weakens-article-13880624.html
- World Bank. (2026). GDP per capita (current US$): India. World Development Indicators. https://data.worldbank.org/indicator/NY.GDP.PCAP.CD?locations=IN
- World Inequality Lab. (2026). World inequality report 2026: India country sheet. https://wid.world/document/world-inequality-report-2026/
Disclaimer
This paper has been prepared for general informational, educational, and strategic discussion using publicly available data and research available as of October 29, 2026. The estimates reflect the methodologies, reference periods, and limitations of their respective sources. Income inequality, wealth inequality, consumption inequality, employment conditions, and consumer market premiumisation are distinct measures and should not be treated as interchangeable.
The four strategic frameworks presented in this article are original conceptual models proposed for analytical and decision-making purposes. Their inclusion does not imply empirical validation, guaranteed outcomes, or formal trademark registration. The trademark symbol (™) identifies the proposed names and does not, by itself, establish registration or exclusive legal rights. The frameworks should be adapted to specific circumstances and evaluated with appropriate evidence before implementation.
This paper is not individualized investment, legal, tax, or financial advice. Economic conditions and policy environments may change after publication. Readers should consult relevant official sources and qualified professionals before making material business, investment, or policy decisions.
© Ratin Mathur | ratinmathur.com. All rights reserved.