Executive Summary
Corporate success increasingly depends on more than the ability to forecast revenue, control expenditure and achieve annual operating targets. Organizations must determine how to strengthen existing businesses while identifying new markets, revenue streams, products, services, acquisitions, geographic opportunities and business models that can sustain growth over the next five to fifteen years.
Annual Operating Plans (AOPs), five-year business plans and ten-year strategic projections remain essential management instruments. However, when these plans predominantly extend historical performance and existing business models, they can overlook structural shifts in customer demand, technological capabilities, competitive economics and industry profit pools.
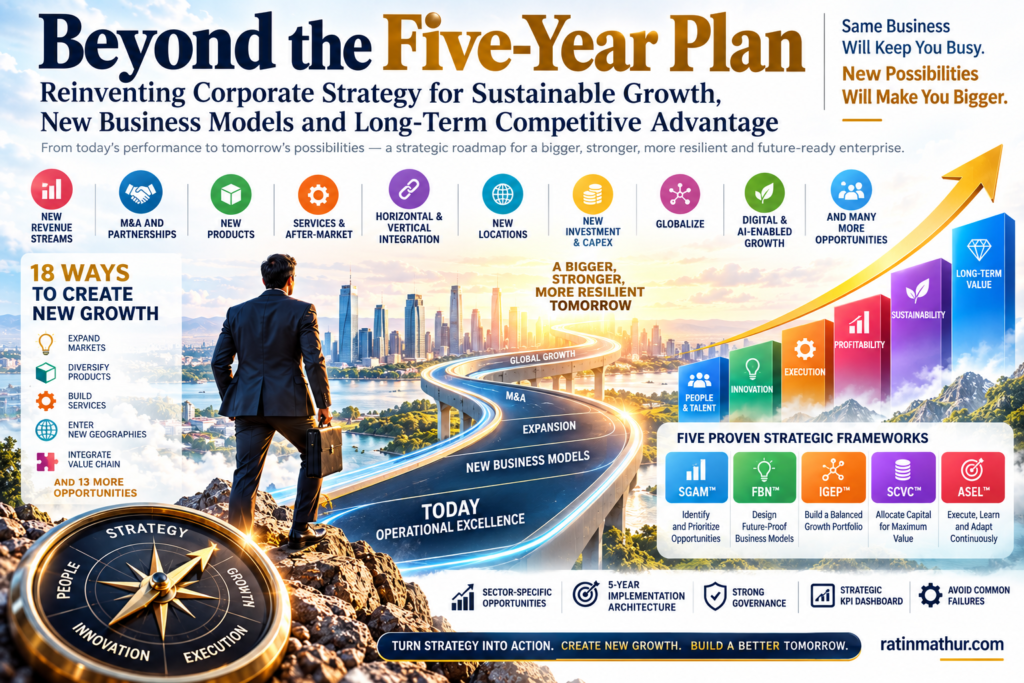
This paper presents an integrated approach to long-term corporate growth that connects strategic ambition with opportunity identification, business model innovation, capital allocation, execution governance and measurable value creation. It examines 18 growth opportunities, provides sector-specific strategic examples, proposes a five-year implementation architecture and establishes governance mechanisms, key performance indicators and failure-prevention measures for corporate strategy execution.
It also introduces five proposed proprietary strategic frameworks: the Strategic Growth Architecture Matrix (SGAM™), Future-Proof Business Model Navigator (FBN™), Integrated Growth Engine Portfolio (IGEP™), Strategic Capital-to-Value Compass (SCVC™) and Adaptive Strategy Execution Loop (ASEL™). These frameworks are designed to connect market attractiveness, competitive advantage, business model selection, investment decisions and implementation.
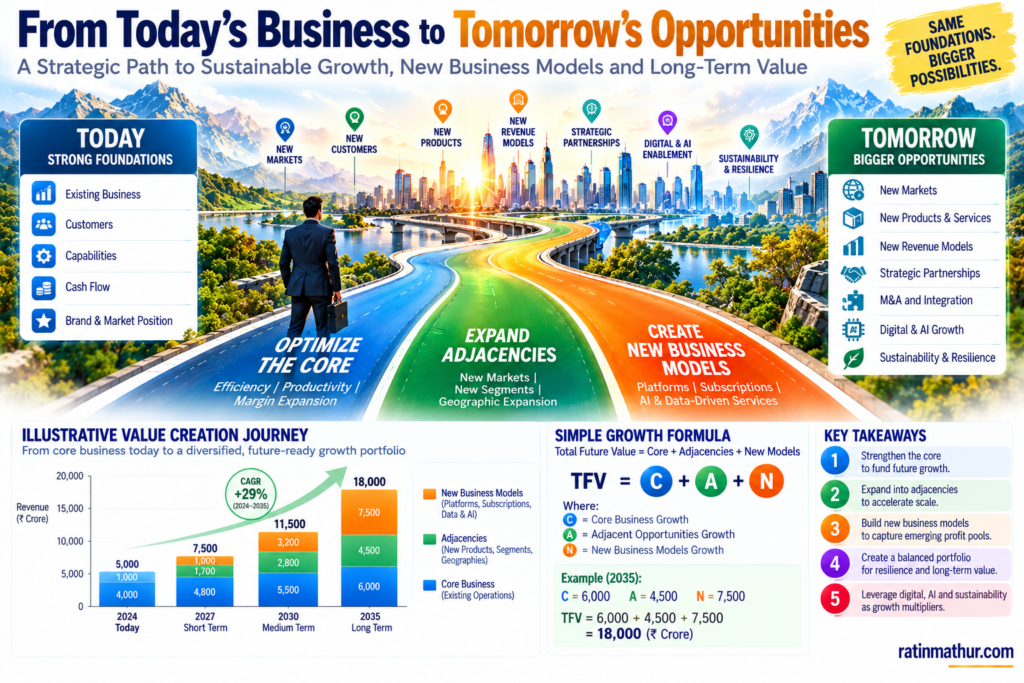
The central recommendation is that organizations should move from static long-range forecasts toward a dynamic strategic growth system. Such a system must simultaneously protect current earnings, expand the core business, develop adjacent opportunities, build future capabilities and redirect capital as market conditions change. The ultimate objective is not merely to become a larger version of the existing company, but to build a more valuable, resilient and strategically adaptable enterprise.
Introduction
Corporate planning has traditionally emphasized revenue targets, budgets, operating expenditure, production capacity, capital expenditure and profitability. These disciplines remain fundamental to business performance. Yet their effectiveness diminishes when management assumes that the company’s existing products, customers, markets and competitive advantages will remain relevant throughout the planning horizon.
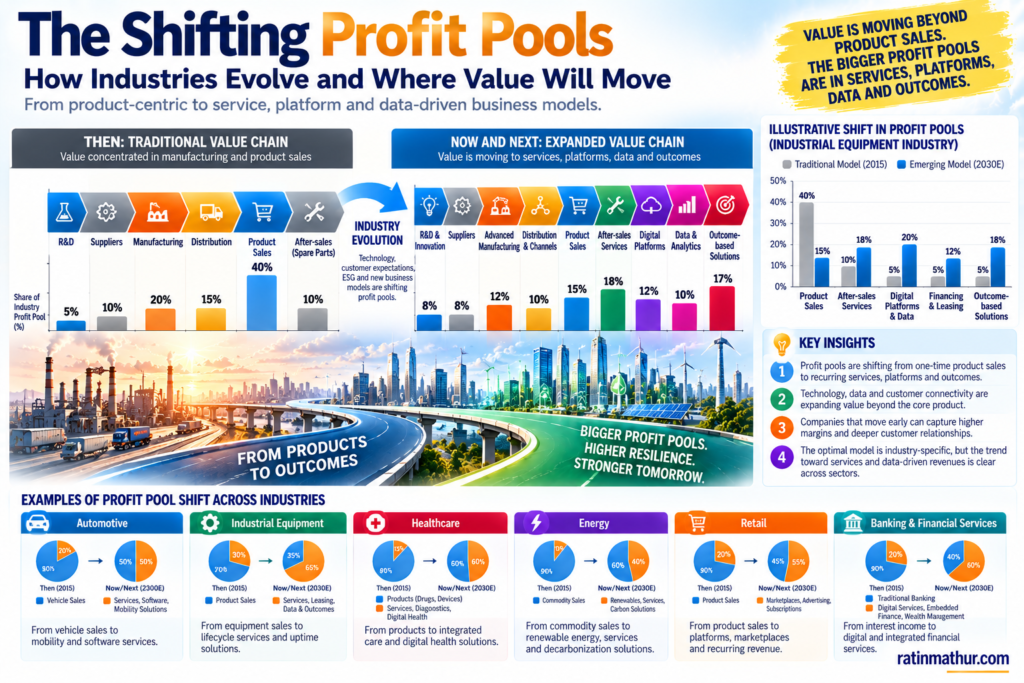
A manufacturer may achieve its five-year sales targets while competitors capture the aftermarket through predictive maintenance and recurring service contracts. A retailer may grow store revenue while digital marketplaces, advertising and third-party seller services become increasingly important profit pools. A technology services company may continue winning projects while competitors develop standardized software products and recurring subscription businesses.
These examples demonstrate the distinction between growing an existing business and developing the next generation of the business.
Ansoff’s (1957) product-market framework established a foundational distinction between market penetration, market development, product development and diversification. Baghai, Coley, and White (1999) subsequently popularized the Three Horizons perspective for managing established businesses, emerging growth engines and future opportunities. Teece (2010) further demonstrated the importance of business models in determining how organizations create and capture value.
The implication is that long-term corporate strategy must extend beyond financial forecasting. It must examine where the company should compete, how it can win, what capabilities it should develop, which activities it should own and how it should monetize customer value.
The challenge is particularly important for established companies whose operating systems, incentives and investments are optimized for their current business models. Their existing strengths may provide the foundation for future growth, but they can also create organizational inertia that makes business model innovation difficult.
This paper proposes an integrated approach that connects current operational performance with future growth creation through structured opportunity assessment, sector-specific strategic choices, capital allocation, implementation governance and continuous adaptation.
Problem Statement & Objectives
The principal problem addressed in this paper is the tendency to treat long-term planning as an extension of the annual budgeting process. Organizations may forecast five or ten years of revenue growth without adequately questioning whether the existing business model, market position and sources of competitive advantage will remain sustainable.
A second problem is the fragmentation of strategic initiatives. Market expansion, product development, M&A, capex, digital transformation, aftermarket services and operational improvement are often managed independently. Consequently, investments may overlap, compete for scarce resources or fail to generate their anticipated combined value.
A third problem is the overemphasis on revenue growth without sufficient attention to incremental profitability, cash flow, capital intensity and risk-adjusted returns. Growth is valuable only when the economic returns justify the resources and risks required to achieve it.
This paper therefore seeks to establish a practical architecture for identifying growth opportunities, evaluating business model alternatives, prioritizing investments and translating long-term ambition into accountable implementation.
Its central research question is: How can organizations systematically expand beyond their existing business models while maintaining operational discipline, financial resilience and sustainable competitive advantage?
Methodology
This paper adopts a conceptual and applied strategic analysis approach. It synthesizes established strategy literature, business model concepts, corporate growth frameworks and illustrative examples from manufacturing, automotive, consumer goods, healthcare, technology, financial services, energy, logistics and agriculture.
The analysis draws on Ansoff’s product-market framework, the Three Horizons perspective, value-chain analysis, business model innovation, dynamic capabilities, scenario planning and capital-allocation principles. Publicly documented corporate examples are used to illustrate strategic mechanisms rather than establish universally replicable outcomes.
The five proposed frameworks are an original synthesis of these concepts. They are intended as practical management tools and should not be interpreted as empirically validated models. Hypothetical business cases are illustrative, and all investment decisions require company-specific market research, financial modeling, due diligence and regulatory assessment.
Landscape Analysis
The Changing Nature of Long-Term Planning
An AOP ordinarily translates business commitments into annual operating and financial targets. A five-year strategic plan should extend beyond the budget by examining competitive positioning, new markets, capabilities, portfolio choices and investment requirements. A ten-year perspective should consider plausible structural changes in technology, demand, regulation and industry economics.
The distinction is not simply the number of years covered. It is the nature of the decisions being made. Operational planning determines how to deliver the existing business. Corporate strategy determines which businesses and markets deserve investment. Business model transformation evaluates whether the company should create and capture value differently.
Changing Sources of Competitive Advantage
Competitive advantage increasingly emerges from combinations of capabilities rather than individual products. Manufacturing scale, distribution networks, intellectual property, customer relationships, proprietary data, service infrastructure and technology can reinforce one another.
Porter’s (1985) value-chain framework provides a foundation for identifying where value is created. Companies should also examine whether attractive profit pools exist beyond their traditional activities, including installation, maintenance, financing, software, refurbishment and direct customer services.
Ownership of every value-chain stage is neither necessary nor desirable. The strategic objective is to identify where ownership creates a defensible advantage and where partnerships, licensing or outsourcing offer superior economics.
New Revenue Models and Capital Allocation
Organizations can expand beyond transactional sales through subscriptions, usage-based pricing, managed services, licensing, outcome-based contracts, marketplaces and asset-based models. Their attractiveness depends on customer demand, delivery economics, capabilities and capital requirements.
At the same time, strategic opportunities compete for limited financial resources and management attention. Capital allocation must therefore connect expected returns with strategic relevance, execution risk, liquidity and alternative uses of capital.
Scenario planning is particularly important for long-term investments whose returns depend on uncertain technological, regulatory or market developments. Rather than relying on one forecast, management should evaluate alternative futures and establish decision thresholds for scaling, modifying or terminating initiatives.
Key Findings
The analysis produces six central findings. Sustainable growth requires a deliberate balance between core-business optimization and future-business development. Existing capabilities often provide the most credible starting point for adjacent growth. Business model innovation can create new profit pools without necessarily abandoning established products. M&A and partnerships can accelerate capability acquisition but do not guarantee value creation. Capital allocation must be integrated with strategic execution. Finally, strategy must remain adaptive because long-term assumptions can change materially.
These findings suggest that a successful strategy is not a static forecast but a structured system of choices, investment decisions and learning mechanisms.
Challenges & Opportunities
Organizations face several recurring challenges when attempting to expand beyond their established business models.
Organizational inertia can favor established products and revenue streams even when new opportunities offer attractive future potential. Capability gaps may delay market entry or make diversification more expensive than anticipated. Capital constraints create trade-offs between maintaining existing assets, expanding capacity and developing new businesses. Acquisitions and international expansion can introduce integration, regulatory and execution risks.
These challenges can be addressed through explicit strategic priorities, capability assessments, stage-gated investment, financial discipline and clear governance. Companies should distinguish between mandatory core investment, validated growth opportunities and uncertain future options. The resulting portfolio should reflect both the organization’s financial capacity and the strategic importance of building new capabilities.
The Opportunity Universe: 18 Ways to Create New Growth
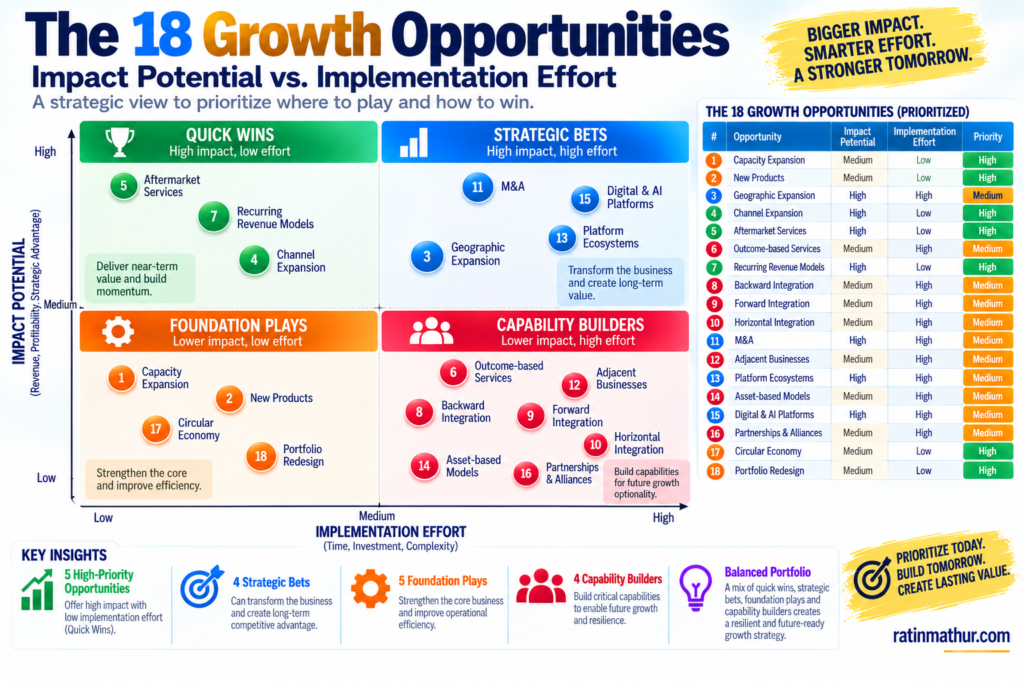
A systematic growth strategy begins with a comprehensive opportunity universe. Management should evaluate growth across products, customers, geographies, value-chain positions, business models and portfolio choices rather than restricting the discussion to incremental sales targets.
Table 1. The 18 strategic growth opportunities
| No. | Growth lever | Strategic mechanism | Illustrative example | Principal decision criteria |
|---|---|---|---|---|
| 1 | Capacity expansion and debottlenecking | Increase productive output through new lines, facilities or improved utilization | A packaging manufacturer adds a high-speed production line | Demand visibility, utilization, incremental margin and capex returns |
| 2 | New products and premiumization | Introduce improved, premium or differentiated products | A food company launches premium and convenience-oriented products | Customer willingness to pay, development cost and cannibalization |
| 3 | Geographic expansion and globalization | Enter new regions and countries through exports, distributors, subsidiaries or joint ventures | An Indian equipment supplier enters the Middle East through a distributor | Market attractiveness, localization, landed cost and regulatory risk |
| 4 | Customer and channel expansion | Access new segments and routes to market | An industrial supplier creates an SME-focused distribution channel | Customer acquisition cost, channel economics and contribution margin |
| 5 | Aftermarket, spares and lifecycle services | Monetize the installed base through maintenance, parts, repair and refurbishment | An agricultural machinery manufacturer expands service contracts | Installed base, service penetration, parts availability and retention |
| 6 | Services and outcome-based monetization | Charge for availability, performance or managed outcomes | A compressor manufacturer charges for agreed equipment availability | Measurable customer outcomes, service cost and contractual liability |
| 7 | Recurring revenue and subscriptions | Introduce recurring contracts, memberships, software or usage plans | An enterprise software provider shifts from perpetual licenses to subscriptions | Renewal, churn, lifetime value and recurring gross margin |
| 8 | Backward vertical integration | Secure critical inputs, components or technologies | An equipment manufacturer develops an in-house critical component | Supply security, make-versus-buy economics and capital intensity |
| 9 | Forward vertical integration | Extend into distribution, installation, financing or customer service | A building materials producer develops an installation network | Customer ownership, channel conflict and operating costs |
| 10 | Horizontal integration | Acquire or consolidate businesses at the same value-chain stage | A regional service provider acquires local competitors | Synergies, purchase price, concentration risk and integration |
| 11 | Mergers and acquisitions | Acquire capabilities, customers, technology or market access | An industrial company acquires a software specialist | Strategic fit, valuation, synergy realization and integration capability |
| 12 | Diversification and adjacent businesses | Enter related markets using transferable capabilities | A pump manufacturer expands into filtration and fluid-management services | Market attractiveness, capability adjacency and economic returns |
| 13 | Platforms, ecosystems and data monetization | Connect customers, suppliers or service providers and monetize participation | An equipment firm connects customers with parts and maintenance providers | Network adoption, data rights, governance and defensibility |
| 14 | New investment and asset-based models | Generate income through leasing, infrastructure or specialized assets | A manufacturer introduces equipment leasing | Utilization, financing cost, residual value and capital returns |
| 15 | Digital and AI-enabled growth | Develop connected products, software and AI-enabled services | A diagnostics company introduces AI-supported workflows | Customer adoption, accuracy, integration cost and compliance |
| 16 | Partnerships, joint ventures and alliances | Access complementary capabilities without building everything internally | A domestic producer partners with an overseas technology company | Governance, intellectual property and partner incentives |
| 17 | Circular economy and lifecycle recovery | Monetize repair, remanufacturing, reuse and recycling | An equipment manufacturer sells certified refurbished components | Reverse logistics, quality, resale demand and warranties |
| 18 | Portfolio redesign, divestment and reinvention | Exit weak businesses and redeploy capital into stronger opportunities | A diversified group sells a low-return business to fund growth elsewhere | Future competitiveness, separation costs and alternative returns |
The table represents a strategic opportunity universe, not a recommendation to pursue all 18 levers. Management should prioritize opportunities according to market attractiveness, the company’s right to win, financial returns, capital availability and implementation capability.
Sector-by-Sector Strategic Growth Opportunities
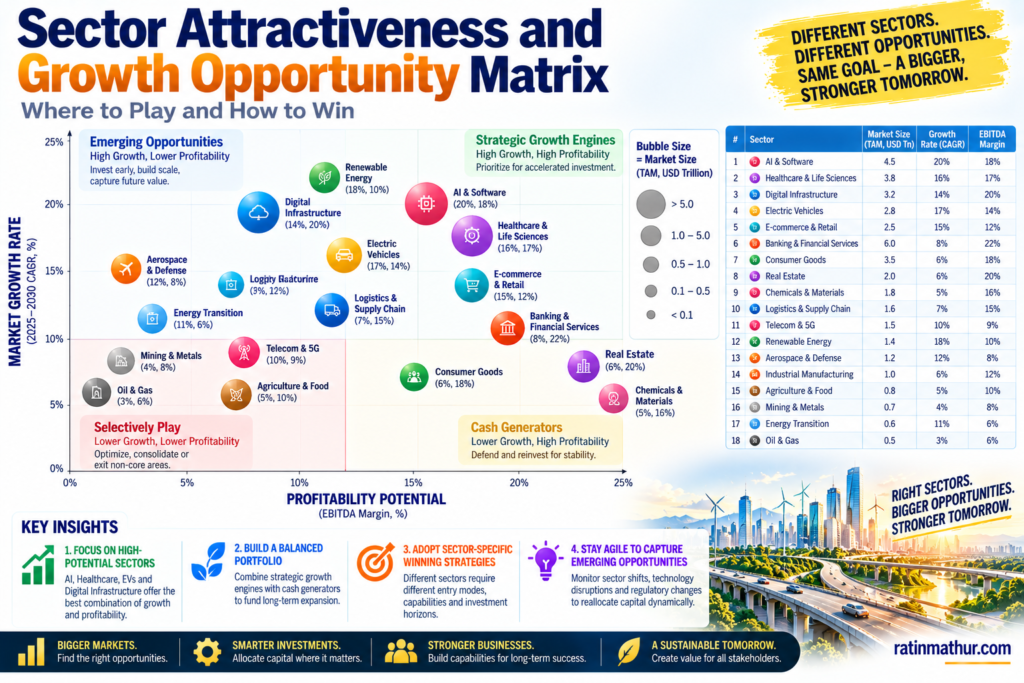
Different industries require different combinations of growth levers. Industrial equipment businesses may benefit from aftermarket services, while technology companies may emphasize recurring revenue and software products. Asset-heavy energy businesses must consider utilization and financing, while healthcare businesses must place greater emphasis on regulatory compliance, scientific capabilities and product validation.
Table 2. Sector-specific strategic growth opportunities
| Sector | Traditional model | Potential growth opportunities | Illustrative strategic example | Key risks and considerations |
|---|---|---|---|---|
| Manufacturing and engineering | Product sales and project delivery | Aftermarket, predictive maintenance, equipment-as-a-service, automation, integration | An equipment manufacturer combines product sales with lifecycle services | Service capability, capital intensity, reliability and customer adoption |
| Automotive and mobility | Vehicle or component sales | EV components, charging, fleet services, connected products, used vehicles | A component supplier expands into thermal management and electronic controls | Technology obsolescence, investment scale and changing standards |
| FMCG and consumer goods | Brand-led product sales through distributors and retailers | Premiumization, exports, institutional sales, niche acquisitions and digital channels | A packaged-food company expands into premium and institutional products | Distribution economics, customer acquisition and product cannibalization |
| Pharmaceuticals and healthcare | Medicines, diagnostics or regulated products | Contract manufacturing, specialized products, licensing, diagnostics and digital workflows | A manufacturer evaluates contract development and manufacturing services | Regulatory compliance, quality systems, intellectual property and development timelines |
| IT services and software | Projects, licenses and professional services | SaaS, managed services, proprietary products, AI solutions and licensing | An IT services company converts repeatable customer solutions into a subscription product | Product investment, churn, cybersecurity and market differentiation |
| Retail and e-commerce | Merchandise sales | Marketplaces, advertising, subscriptions, private labels and fulfillment services | A retailer develops seller services and paid membership offerings | Platform adoption, logistics costs and channel conflict |
| Banking and insurance | Interest spreads, fees and premiums | Embedded finance, digital lending, wealth management and modular insurance | A bank develops integrated cash-management services for SMEs | Credit risk, regulation, fraud and capital requirements |
| Energy and infrastructure | Asset ownership, project delivery or contracted services | Renewable energy, storage, efficiency services and asset maintenance | An engineering firm adds energy audits and long-term monitoring | Financing, construction, utilization and regulatory risk |
| Logistics and supply chain | Freight, transport and warehousing | Contract logistics, cold chain, digital visibility, returns and fulfillment | A transport operator becomes an integrated logistics provider | Network density, utilization, working capital and service penalties |
| Agriculture and agribusiness | Inputs, machinery, commodities and processing | Leasing, precision agriculture, storage, processing, exports and branded products | An agricultural machinery dealer adds seasonal rentals and maintenance | Seasonality, credit availability, geographic coverage and local regulation |
The common strategic pattern is a shift from isolated transactions toward broader customer relationships, lifecycle services and complementary value-chain activities. However, each company must establish whether these opportunities generate attractive economics within its own market conditions.
Five-Year Implementation Architecture
A five-year strategy should be implemented as a sequence of connected decisions rather than a fixed document. The first phase establishes the strategic baseline and identifies opportunities. Subsequent phases validate, build and scale selected growth engines while continuously reviewing investment assumptions.
Table 3. Five-year implementation roadmap
| Phase | Time horizon | Strategic priorities | Key activities | Expected deliverables |
|---|---|---|---|---|
| Phase 1: Diagnose and choose | First 90 days | Establish the baseline and strategic direction | Assess performance, markets, capabilities, customers and growth opportunities | Strategic diagnostic, opportunity portfolio and initial business cases |
| Phase 2: Validate and launch | Months 3–12 | Test demand and establish execution discipline | Conduct customer validation, launch pilots, build partnerships and establish KPIs | Validated initiatives, funded pilots and first-year strategic targets |
| Phase 3: Build growth engines | Years 1–2 | Develop new products, services, markets and capabilities | Scale validated initiatives, establish channels, develop talent and execute approved transactions | Emerging businesses with demonstrated customer demand |
| Phase 4: Scale and integrate | Years 2–3 | Expand successful initiatives and realize synergies | Extend geographic coverage, integrate acquisitions and optimize delivery models | Material contributions from new revenue streams and improved capital productivity |
| Phase 5: Rebalance and reinvent | Years 3–5 | Optimize the portfolio and establish the next strategic horizon | Reallocate capital, scale winners, exit weak initiatives and refresh long-term scenarios | A stronger core, diversified growth portfolio and updated long-range strategy |
These phases should overlap where practical. Customer validation and future-market exploration should begin before the completion of annual budgeting, while major capital commitments should remain subject to defined investment thresholds.
During the first 90 days, management should produce a strategic ambition, a ranked opportunity portfolio, a five-year financial model, a capital-allocation proposal and a funded implementation plan. This ensures that strategy development results in actionable decisions rather than a lengthy presentation without clear ownership.
Governance: How to Prevent Strategy from Becoming a Presentation
Strategy fails when leadership approves ambitious initiatives but does not establish the organizational mechanisms required to deliver them. Effective governance must connect strategic choices with funding, accountability, performance reviews and the authority to change course.
Table 4. Recommended strategy governance structure
| Governance level | Principal responsibility | Decision rights | Review cadence |
|---|---|---|---|
| Board or investment committee | Approve strategic ambition and major investments | Portfolio direction, major capex, acquisitions and risk appetite | Quarterly or semiannually |
| CEO and executive strategy council | Coordinate enterprise strategy and resource allocation | Strategic priorities, portfolio trade-offs and major initiative decisions | Quarterly |
| Growth and business development | Develop new markets, products, channels and partnerships | Opportunity pipeline and commercial development within approved limits | Monthly |
| Finance and capital allocation | Validate economics and financial performance | Investment appraisal, funding controls and benefits verification | Monthly and at investment gates |
| Transformation office | Coordinate cross-functional implementation | Milestones, dependencies, risks and escalation | Monthly |
| Business-unit leaders | Deliver operating and strategic commitments | Business execution and approved initiative decisions | Monthly |
| Initiative owners | Deliver agreed outcomes and milestones | Day-to-day implementation within delegated authority | Weekly or monthly, as appropriate |
The governance system should distinguish operating performance reviews from strategic portfolio reviews. Monthly operating reviews should examine AOP delivery, revenue, costs, production and cash flow. Strategic reviews should examine customer adoption, initiative milestones, capability development, risk and the continuing validity of investment assumptions.
Major initiatives should progress through explicit stage gates covering strategic fit, customer validation, economic viability, capability readiness and scale approval. An initiative that fails to meet its agreed thresholds should be redesigned, deferred or discontinued rather than automatically receiving further funding.
A strategy execution office can coordinate these activities, but it should not replace executive accountability. Business-unit leaders remain responsible for results, finance validates the economic case, and the executive team makes cross-business resource-allocation decisions.
The Strategic KPI Dashboard
A strategy dashboard should measure both the financial results of existing operations and the leading indicators that determine future growth. Revenue and EBITDA are essential but insufficient measures of strategic progress.
Table 5. Strategic KPI dashboard
| Performance dimension | Core KPIs | Strategic purpose | Typical review frequency |
|---|---|---|---|
| Growth | Revenue CAGR, organic growth, new-customer revenue, market share | Measure expansion and competitive position | Monthly and quarterly |
| Profitability | Gross margin, EBITDA margin, incremental contribution margin | Determine whether growth improves operating economics | Monthly |
| Capital and cash | Free cash flow, ROIC, capex utilization, working capital and payback | Assess capital productivity and financial resilience | Monthly and quarterly |
| Recurring revenue | Recurring revenue share, renewal rate, churn, service attachment rate | Measure the development of repeatable customer relationships | Monthly and quarterly |
| Innovation | Pilot conversion, time to market, customer adoption and validated opportunities | Assess the quality and progress of new growth initiatives | Monthly and quarterly |
| Customer performance | Retention, satisfaction, customer acquisition cost and lifetime value | Test the sustainability of customer economics | Monthly and quarterly |
| Execution | Milestone attainment, budget variance, delivery time and benefits realized | Ensure strategic initiatives are implemented as planned | Monthly |
| Resilience and risk | Customer concentration, supplier exposure, scenario performance and regulatory compliance | Monitor structural vulnerabilities | Quarterly |
| Portfolio value | Initiative NPV, investment returns, capital committed and value realized | Support capital reallocation and portfolio decisions | Quarterly |
KPIs should be adapted to the maturity of each initiative. An established business should be evaluated on profitability, cash flow and return on capital. An emerging service business may initially require stronger emphasis on adoption, retention and unit economics. A technology pilot may need to demonstrate technical feasibility and customer value before it can reasonably be evaluated against mature-business financial targets.
Management should also distinguish forecast benefits from realized benefits. Expected synergies, pipeline opportunities and planned savings should not be reported as achieved value until the underlying results have been independently validated.
Common Strategic Planning Failures and How to Avoid Them
Long-term strategy commonly underperforms because companies confuse financial forecasting with strategic choice, pursue too many initiatives or fail to connect investment approval with implementation.
Table 6. Strategic planning failures and corrective actions
| Failure mode | Why it undermines performance | Recommended correction |
|---|---|---|
| Extrapolating historical growth | Assumes that existing market conditions and competitive advantages will persist | Develop multiple scenarios and identify structural market changes |
| Too many initiatives | Dilutes capital, management attention and accountability | Prioritize a limited number of strategic growth engines |
| Revenue targets without unit economics | Growth may consume cash and destroy value | Require contribution margin, cash flow and return analysis for each initiative |
| Unrelated diversification | Introduces complexity without a defensible advantage | Assess capability adjacency and the company’s right to win |
| Acquisitions without integration planning | Prevents the realization of anticipated synergies | Establish an integration plan, accountable owners and milestone-based tracking |
| Capex before demand validation | Creates underutilized assets and fixed-cost exposure | Stage investments and link capacity additions to validated demand |
| Digital initiatives disconnected from outcomes | Technology implementation becomes the objective rather than the means | Tie digital investments to measurable customer, revenue, cost or risk outcomes |
| Ignoring the core business | Weakens the earnings and cash generation needed to fund transformation | Protect core performance while developing future growth |
| Annual-only strategy reviews | Delays responses to changing conditions | Conduct quarterly portfolio reviews and trigger-based reassessments |
| No exit criteria | Sunk costs encourage continued funding of weak initiatives | Define investment thresholds and stop-or-redesign conditions before approval |
A further risk is the tendency to assume that a successful strategy in one company can be replicated without accounting for differences in market structure, customer behavior, capabilities and financial resources. Corporate examples should be used to generate hypotheses, not replace company-specific analysis.
Recommended Strategy Architecture for Different Company Types
The strategic portfolio should reflect the organization’s maturity, market position, capital structure, capabilities and industry economics. There is no universally optimal mix of core investment, diversification, acquisitions and business model transformation.
Table 7. Strategy architecture by company type
| Company type | Primary strategic priorities | Secondary opportunities | Principal risks | Recommended emphasis |
|---|---|---|---|---|
| Established mature company | Core productivity, pricing, aftermarket and adjacent growth | Selective M&A, new markets and divestments | Stagnation and declining competitiveness | Protect earnings while building new profit pools |
| High-growth company | Capacity, talent, distribution and product-market expansion | Internationalization and recurring business models | Scaling faster than organizational capabilities | Build repeatable operations and strengthen unit economics |
| Family-owned or promoter-led business | Professionalization, channel expansion and product adjacencies | Partnerships, acquisitions and governance modernization | Management concentration and succession-related constraints | Strengthen governance and diversify sources of growth |
| Asset-heavy industrial company | Utilization, debottlenecking, lifecycle services and disciplined capex | Vertical integration and digital monitoring | Leverage, underutilized assets and cyclical demand | Prioritize capital productivity and lifecycle monetization |
| Technology or IT services company | Productization, subscriptions, AI-enabled offerings and managed services | Strategic acquisitions and platform models | Commoditization and technology disruption | Develop differentiated intellectual property and recurring economics |
| Consumer company | Brand, distribution, premiumization and product innovation | Exports, digital channels and niche acquisitions | Margin erosion and high acquisition costs | Combine brand strength with disciplined channel and portfolio economics |
| Conglomerate or diversified group | Portfolio optimization and capital reallocation | Acquisitions, divestments and new platforms | Excessive complexity and weak capital discipline | Allocate capital according to risk-adjusted portfolio returns |
| Company in structural decline | Cash preservation, repositioning and selective reinvestment | Asset sales, partnerships and business-model replacement | Delayed restructuring and stranded assets | Make decisive portfolio choices and preserve strategic options |
A mature industrial company, for example, may create greater value through aftermarket services, pricing and capacity productivity than by entering an unrelated industry. A technology company may find greater opportunity in productization and recurring revenue than in physical-asset investment. A conglomerate may generate substantial value by selling low-return businesses and reallocating capital toward stronger opportunities.
The recommended architecture is therefore company-specific, but the underlying principles remain consistent: identify attractive profit pools, establish a credible right to win, evaluate full economic returns, fund priorities deliberately and maintain the ability to adapt.
Strategic Frameworks & Recommendations
The following five proposed frameworks provide a connected system for implementing the preceding recommendations. Their names and abbreviations are proposed strategic identifiers, not claims of registered trademark status or empirical validation.
Strategic Framework 1: Strategic Growth Architecture Matrix (SGAM™)
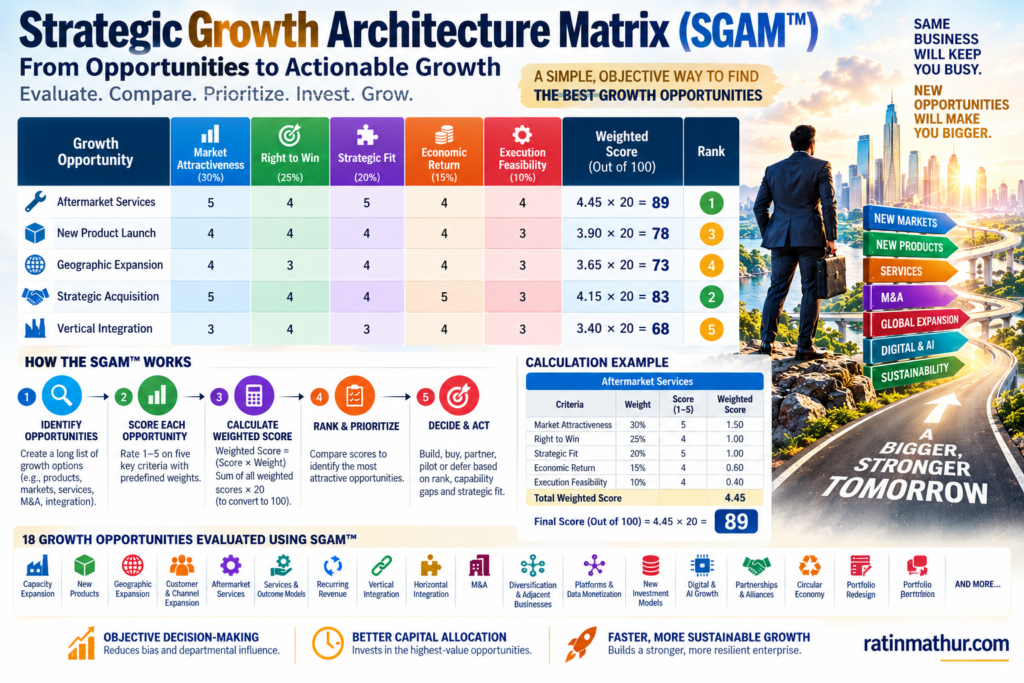
The Strategic Growth Architecture Matrix™ identifies and prioritizes growth opportunities according to market attractiveness, the company’s right to win, required business model change and expected economic contribution. Its purpose is to prevent management from pursuing every attractive market or concentrating exclusively on familiar opportunities.
SGAM™ begins with an inventory of potential growth sources, including core optimization, geographic expansion, product development, aftermarket services, value-chain integration, acquisitions and business model innovation. Each opportunity is then assessed for market size, growth, profitability, customer demand, competitive intensity, capability requirements, capital needs and execution risk. Management distinguishes opportunities that can be scaled immediately from those requiring new capabilities or additional market validation.
Consider an industrial equipment manufacturer evaluating factory expansion, exports, aftermarket contracts and equipment leasing. The framework would compare the potential returns and strategic requirements of each initiative. Aftermarket services may build on existing customer relationships and installed assets, while leasing may require additional financing expertise and exposure to residual-value risk. Exports may require local distribution and service infrastructure. The decision should reflect the company’s competitive advantage and financial capacity rather than headline revenue potential alone.
Table 8. SGAM™ application
| Evaluation category | Management question | Expected output |
|---|---|---|
| Market attractiveness | Is the profit pool sufficiently large and attractive? | Market and segment assessment |
| Right to win | Can the company establish a defensible advantage? | Capability and competitive assessment |
| Business model change | Does the opportunity extend or transform the current model? | Strategic design requirements |
| Economic contribution | Are the returns commensurate with the risks and resources? | Initial financial business case |
| Execution feasibility | Can the organization deliver the initiative? | Capability and implementation plan |
The output is a ranked opportunity portfolio identifying which initiatives to build, buy, partner, pilot, defer or reject. SGAM™ should be applied before major funding commitments and refreshed when competitive conditions or strategic assumptions change.
Strategic Framework 2: Future-Proof Business Model Navigator (FBN™)
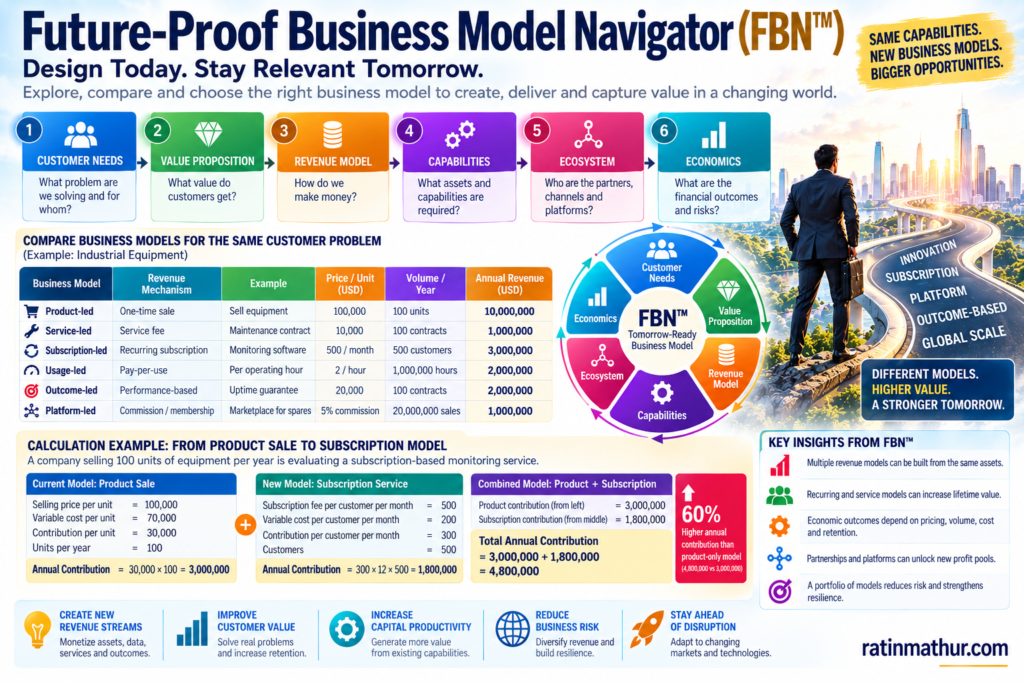
The Future-Proof Business Model Navigator™ evaluates alternative ways of creating, delivering and capturing value. It encourages management to move beyond the assumption that the existing product and revenue mechanism must remain unchanged.
The framework examines customer needs, value propositions, revenue models, delivery capabilities, partner ecosystems and economic outcomes. A company may consider product sales, subscriptions, usage-based charges, managed services, licensing, leasing or performance-linked agreements. Each model must be evaluated for customer willingness to pay, delivery costs, capability requirements, risks and capital intensity.
A compressor manufacturer, for example, may move from selling equipment and separately charging for maintenance to offering uptime commitments or charging according to equipment usage. Such a transition can deepen customer relationships and create recurring income, but it also increases responsibility for reliability, maintenance and performance. A software company may similarly convert repeated consulting solutions into a standardized subscription product, provided customer demand and product economics support the investment.
Table 9. FBN™ business model assessment
| Model | Revenue mechanism | Principal benefit | Principal risk |
|---|---|---|---|
| Product-led | Sale of products | Clear transaction economics | Demand cyclicality |
| Service-led | Maintenance and service fees | Lifecycle monetization | Service delivery costs |
| Subscription-led | Recurring payments | Revenue visibility when retention is strong | Churn and acquisition cost |
| Usage-led | Consumption-based charges | Alignment with usage | Utilization and demand variability |
| Outcome-led | Payments linked to results | Alignment with customer value | Performance liability |
| Platform-led | Fees, commissions or advertising | Multiple revenue sources | Adoption and governance complexity |
FBN™ should produce a documented comparison of the current business model and proposed alternatives, including revenue drivers, unit economics, capabilities, customer validation and implementation requirements. The objective is to select models that create measurable customer value and defensible economics rather than pursue recurring revenue or digital transformation as ends in themselves.
Strategic Framework 3: Integrated Growth Engine Portfolio (IGEP™)
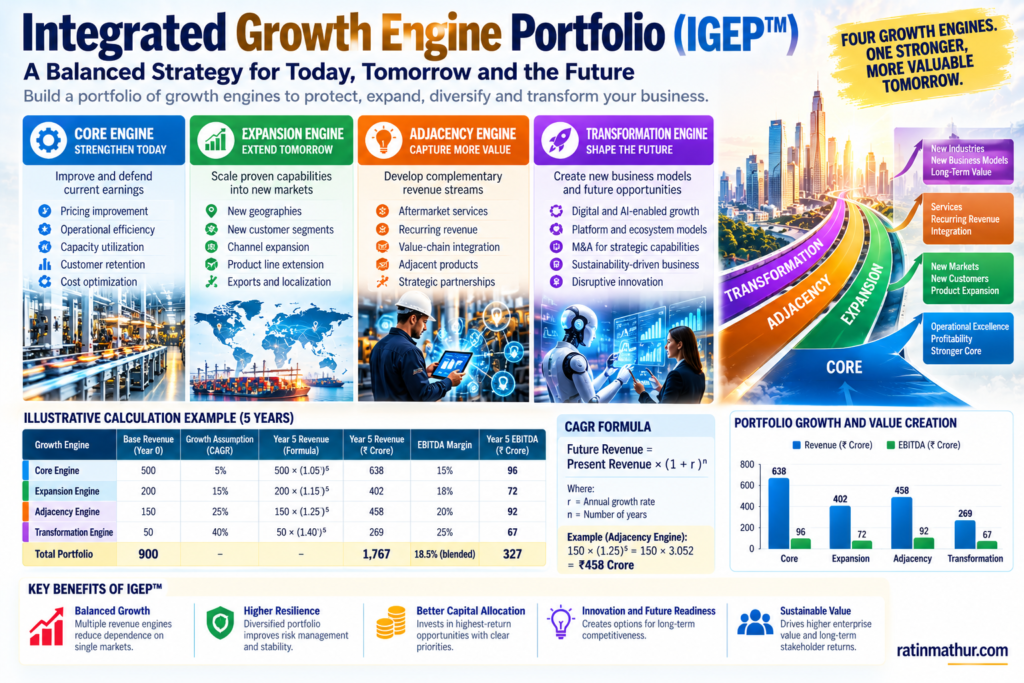
The Integrated Growth Engine Portfolio™ structures the company’s growth agenda into a balanced set of core, expansion, adjacency and transformation initiatives. It recognizes that established businesses, emerging revenue streams and future options operate on different timelines and require different management approaches.
Core engines improve existing profitability through pricing, productivity and retention. Expansion engines extend proven capabilities into new products, customer segments and geographies. Adjacency engines develop complementary businesses such as aftermarket services, related products and selective vertical integration. Transformation engines explore new platforms, technologies, major acquisitions and business models that may create future competitive advantage.
A diversified engineering company could use IGEP™ to manage four concurrent agendas: productivity improvements in its core manufacturing operations, export expansion, aftermarket services and digital monitoring. Each agenda would have its own business case and milestones, but all would be reviewed as part of one portfolio. This would allow leadership to balance near-term cash generation with the funding requirements of new businesses.
Table 10. IGEP™ portfolio architecture
| Growth engine | Purpose | Typical KPIs |
|---|---|---|
| Core | Protect and strengthen earnings | EBITDA, productivity and cash flow |
| Expansion | Extend proven capabilities | Incremental revenue and market penetration |
| Adjacency | Capture complementary profit pools | Service attachment, retention and incremental returns |
| Transformation | Develop future competitive positions | Pilot conversion, validated demand and strategic milestones |
IGEP™ requires clear ownership, funding envelopes and stage gates for each initiative. Portfolio reviews should examine performance, interdependencies, management capacity and the relative attractiveness of alternative uses of capital. Initiatives that demonstrate strong economics should be scaled; those that fail to meet agreed thresholds should be redesigned or discontinued.
Strategic Framework 4: Strategic Capital-to-Value Compass (SCVC™)
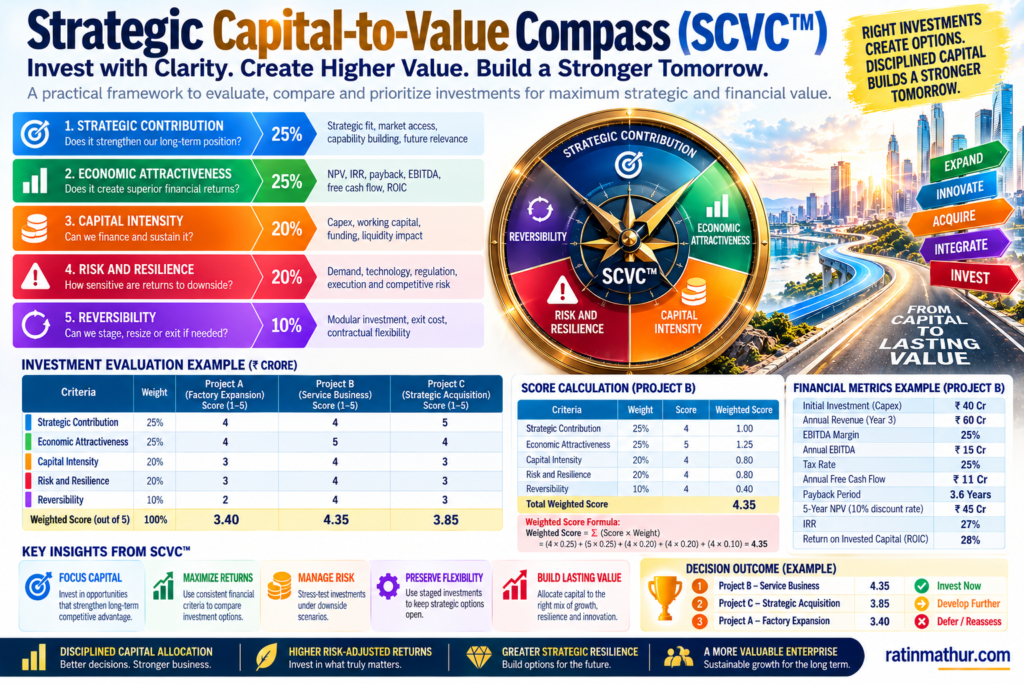
The Strategic Capital-to-Value Compass™ connects strategic ambition with capital allocation. Its premise is that investment decisions should be based on the expected creation of long-term economic value, adjusted for risk, capital requirements and execution feasibility.
The framework evaluates strategic contribution, economic attractiveness, capital intensity, risk and reversibility. Financial measures may include NPV, IRR, payback, incremental margins, free cash flow and return on invested capital. Risk assessment should include demand uncertainty, financing conditions, regulatory exposure, execution complexity and the consequences of downside scenarios.
Consider a company choosing between a new factory, a regional acquisition and an aftermarket service business. The factory may offer scale economies but depend on sustained demand and high utilization. The acquisition may accelerate market entry but introduce valuation and integration risks. The service business may require less physical capex but depend on customer adoption and service capabilities. SCVC™ would compare the opportunities on a common basis and determine whether they should be funded immediately, staged, deferred or rejected.
Table 11. SCVC™ investment assessment
| Dimension | Required analysis | Decision implication |
|---|---|---|
| Strategic contribution | Fit with future competitive positioning | Prioritize strategically relevant investments |
| Economic attractiveness | NPV, IRR, cash flow and ROIC | Establish financial return thresholds |
| Capital intensity | Capex, working capital and liquidity | Protect funding capacity |
| Risk and resilience | Scenario analysis and downside exposure | Adjust commitment and safeguards |
| Reversibility | Staged funding, exit costs and flexibility | Preserve options under uncertainty |
SCVC™ should be incorporated into the formal investment approval process. Every major initiative should have a baseline business case, accountable owner, funding schedule, milestone conditions and post-investment review. Capital should be redirected when new evidence materially changes the expected value of an investment.
Strategic Framework 5: Adaptive Strategy Execution Loop (ASEL™)
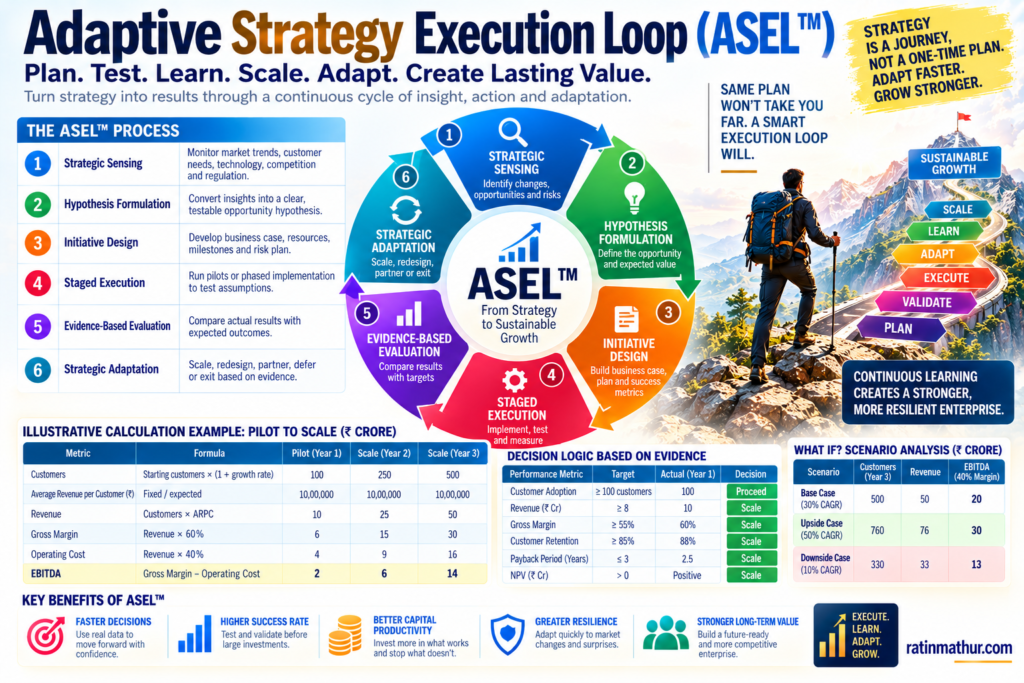
The Adaptive Strategy Execution Loop™ ensures that long-term strategy remains responsive to changing evidence rather than becoming a fixed document. It connects market sensing, hypothesis development, initiative design, staged execution, evaluation and strategic adaptation.
Management first identifies emerging market or competitive signals, then formulates explicit hypotheses about potential opportunities. These hypotheses are translated into business cases and pilots with defined success criteria. Actual results are compared with expectations, and the company decides whether to scale, redesign, partner, defer or discontinue the initiative.
For example, a healthcare technology company developing an AI-enabled diagnostic workflow could initially test technical performance, user acceptance, integration costs and regulatory compliance in a controlled pilot. If the results demonstrate sufficient customer value and acceptable economics, the company can expand deployment. If implementation costs remain too high, it may redesign the product or partner with an established provider. If essential performance or compliance thresholds are not met, further investment should be reconsidered.
Table 12. ASEL™ execution cycle
| Stage | Activity | Decision output |
|---|---|---|
| Strategic sensing | Monitor customer, market and technology changes | Updated opportunities and risks |
| Hypothesis formulation | Define the expected source of advantage | Testable strategic hypothesis |
| Initiative design | Establish business case, owner and milestones | Approved pilot or implementation plan |
| Staged execution | Implement and collect evidence | Operational and customer results |
| Evaluation | Compare results with agreed thresholds | Continue, redesign or stop |
| Adaptation | Reallocate resources and update assumptions | Revised strategic portfolio |
ASEL™ should operate alongside the AOP rather than replace it. Monthly reviews should examine execution, customer adoption and financial performance. Quarterly portfolio reviews should consider resource allocation and dependencies. Annual strategy reviews should revisit the long-term ambition, while major market changes should trigger reassessment when necessary.
The framework promotes disciplined adaptability. It allows management to remain accountable for results without continuing to fund initiatives whose strategic assumptions have become invalid.
Integrating the Five Frameworks
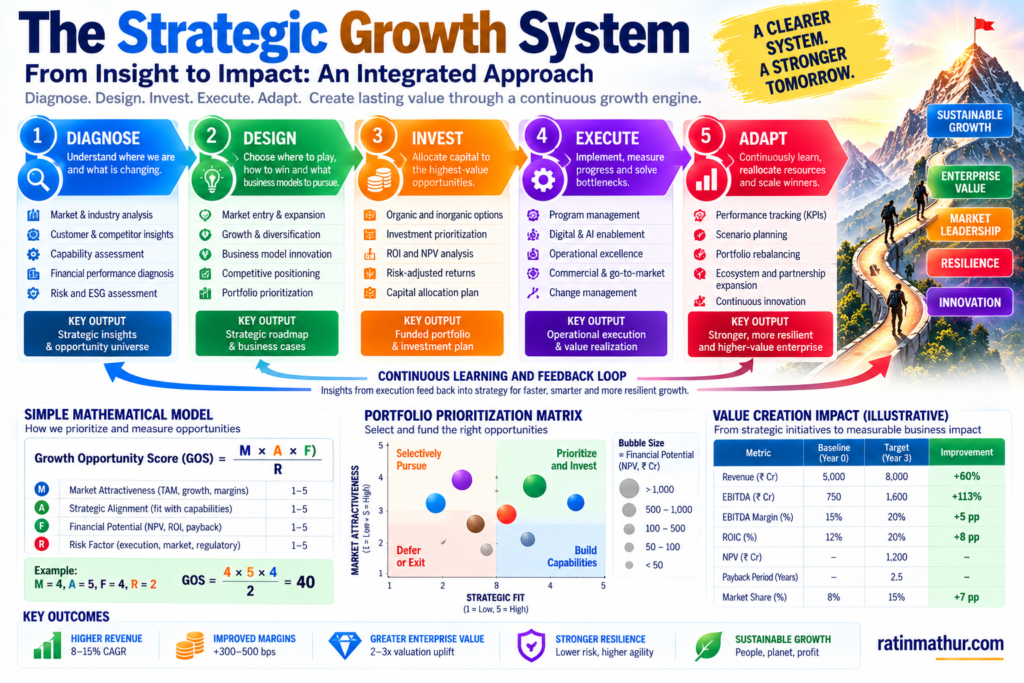
The five frameworks form a connected strategic management system. SGAM™ identifies where the company can compete and win. FBN™ determines how value can be created and monetized. IGEP™ organizes opportunities into a balanced growth portfolio. SCVC™ establishes investment priorities and financial safeguards. ASEL™ governs execution, learning and strategic adaptation.
Table 13. Integrated framework architecture
| Strategic stage | Framework | Core decision | Primary deliverable |
|---|---|---|---|
| Opportunity discovery | SGAM™ | Where can the company grow and win? | Ranked opportunity portfolio |
| Business model design | FBN™ | How should value be created and captured? | Business model alternatives |
| Growth portfolio design | IGEP™ | How should growth engines be balanced? | Integrated growth portfolio |
| Capital allocation | SCVC™ | Which investments justify funding? | Risk-adjusted investment plan |
| Execution and adaptation | ASEL™ | What should be scaled, redesigned or stopped? | Implementation and review system |
The frameworks should be implemented through a structured process beginning with a baseline diagnostic, followed by opportunity assessment, business model design, financial evaluation, executive approval and staged execution. Their effectiveness will depend on the quality of evidence, the discipline of investment appraisal, leadership commitment and the organization’s ability to implement change.
Future Outlook & Conclusion
The next decade will require companies to reconsider how long-term planning, competitive advantage and business model innovation interact. Artificial intelligence, automation, evolving customer expectations, sustainability requirements and changing industry economics may create new profit pools while weakening established sources of revenue.
The strategic challenge is not to predict the future with certainty. It is to build an organization capable of responding intelligently to several plausible futures. Companies must protect the economics of their core operations while developing adjacent businesses, acquiring capabilities where justified and testing alternative business models before competitive pressure makes adaptation unavoidable.
The five proposed frameworks provide a practical architecture for this task. They connect opportunity identification with business model design, portfolio management, capital allocation and execution governance. Their purpose is to establish a disciplined process for deciding what the company should build, buy, partner, scale or exit.
Ultimately, the strongest long-term strategies do not merely forecast what the company will look like in five or ten years. They define the choices required to create that future, establish the resources and capabilities needed to deliver it and create mechanisms for adapting when evidence changes.
The annual operating plan must deliver today’s commitments, the medium-term growth strategy must develop tomorrow’s earnings, and the long-term corporate strategy must continually shape what the company is capable of becoming. Sustainable competitive advantage emerges when these responsibilities operate as one integrated management system.
References
- Ansoff, H. I. (1957). Strategies for diversification. Harvard Business Review, 35(5), 113–124. https://books.google.com/books?q=Ansoff+Strategies+for+Diversification+1957
- Baghai, M., Coley, S., & White, D. (1999). The alchemy of growth: Practical insights for building the enduring enterprise. Perseus Books. https://books.google.com/books?q=Baghai+Coley+White+The+Alchemy+of+Growth
- Osterwalder, A., & Pigneur, Y. (2010). Business model generation: A handbook for visionaries, game changers, and challengers. John Wiley & Sons. https://www.strategyzer.com/library/business-model-generation
- Porter, M. E. (1985). Competitive advantage: Creating and sustaining superior performance. Free Press. https://books.google.com/books?q=Michael+Porter+Competitive+Advantage+1985
- Rolls-Royce. (n.d.). TotalCare. https://www.rolls-royce.com/media/our-stories/discover/2017/totalcare.aspx
- Schoemaker, P. J. H. (1995). Scenario planning: A tool for strategic thinking. Sloan Management Review, 36(2), 25–40. https://shop.sloanreview.mit.edu/store/scenario-planning-a-tool-for-strategic-thinking
- Teece, D. J. (2010). Business models, business strategy and innovation. Long Range Planning, 43(2–3), 172–194. https://doi.org/10.1016/j.lrp.2009.07.003
- Amazon.com, Inc. (2026). Annual report for the fiscal year ended December 31, 2025 (Form 10-K). U.S. Securities and Exchange Commission. https://www.sec.gov/Archives/edgar/data/1018724/000101872426000004/amzn-20251231.htm
Disclaimer
This article is intended for general informational, educational and strategic discussion purposes. It does not constitute investment, financial, legal, tax, accounting or other professional advice. Sector examples and hypothetical business cases are illustrative and should not be interpreted as recommendations to undertake particular investments, acquisitions or market entries. Actual decisions require company-specific due diligence, validated market data, financial modeling, regulatory assessment and professional judgment.
The five frameworks presented in this article are proposed conceptual management frameworks. Their inclusion does not establish that their names or abbreviations are registered trademarks, legally available for exclusive use or independently validated through empirical research. The ™ symbol indicates intended trademark identification only. Any commercial use, publication or formal branding should be preceded by appropriate trademark availability searches and legal review.